Technical Analysis - From Getting Started to Trading
Stocks Technical Analysis Entrance? Buy Sell and Sell Key Points with Stock Chart Analysis!
In the stock market, there are two main types of methods for analyzing stocks:Fundamental AnalysisundTechnical analysis。 Fundamental Analysis is based on the financial situation of the research company, the Industry outlook and the economic environment to assess the intrinsic value of the enterprise. Technical analysis focuses on market data such as Stock Price Trends and Volume, so that no moves are predicted through charts and technical indicators. Two people are better off, what kind of analysis should I choose to invest in? This article will tell you in detail to help you find the right investment strategy for you!
What is Technical Analysis?
Technical analysisIt is a method to predict price trends by studying Stock Price Trends and Market Data such as Volume. Use technical analysis to identify market trends and trade opportunities by focusing on charts and technical indicators. Common technical analysis tools include:
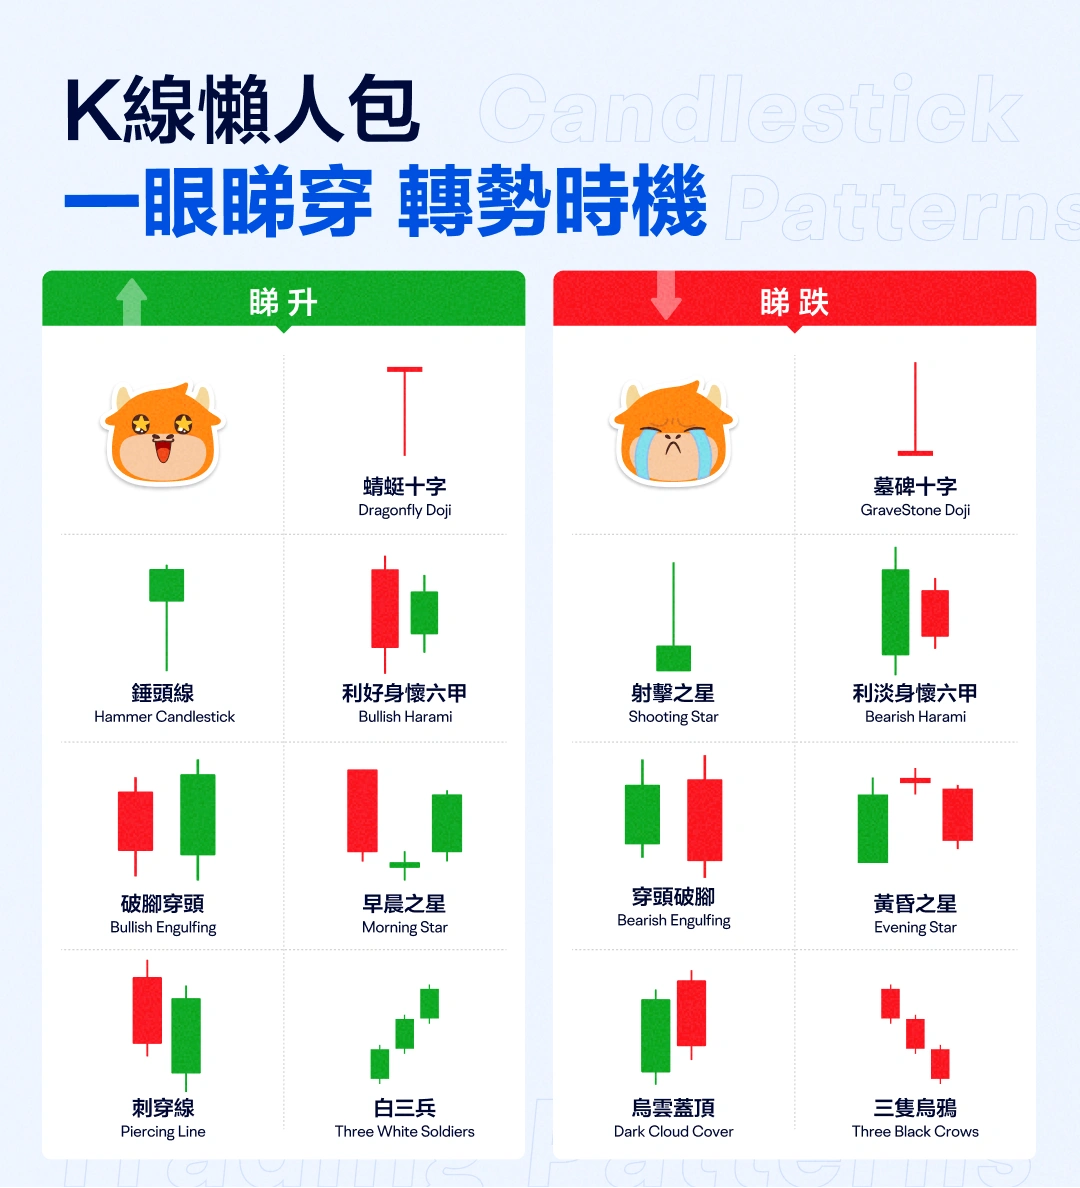
Yin Yang Candle (K-line diagram): Each candle represents the opening price, closing price, high price and minimum price for a certain period of time. The main components of Yin Yang candles include candlesticks and shadows. Candlesticks show the price range between the opening and closing prices, while the ribbon displays the highest and lowest prices. The color of the candle is usually used to indicate a rise or fall in price, generally green indicates a rise in price, and red indicates a decrease in price.
Trendlines: Link the highs or lows of the price to help identify the upward or downward trend of the price.
Futu offers a wide rangeDrawing ToolsHelp you find the keyStress and Resistance, judging the market to be buying and selling weak.

Technical Indicator: Use a tool to analyze the Price and Trade Volume of Stocks or other investment products. These Indicators are based on past price and trade data to help investors better understand market trends and predict future price trends. Common Technical Indicators include:
Relative Weakness Index (RSI): Stocks are not bought or oversold.
INDEX SMOOTH HETEROGENEOUS MOVING AVERAGE (MACD): Differences made up of two-line moving averages and one-line signals to help investors identify indicators of sell signals and weak momentum (Momentum).
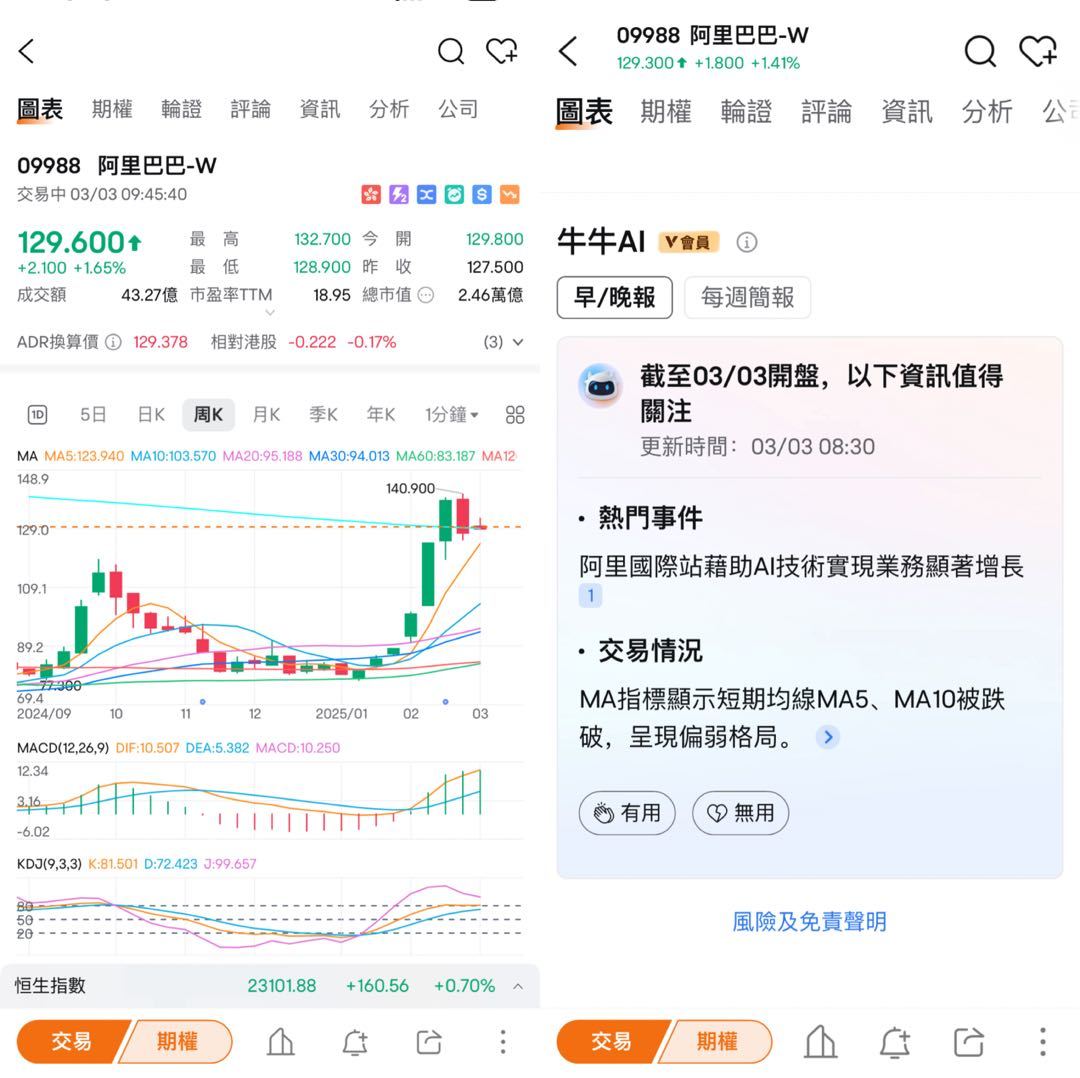
Moving Average (MA): Used to smooth price data to help identify trend directions and potential buy and sell points.
Bollinger Bands: Also known as the Boolean Channel. Technical analysis tools that use moving averages and standard spreads to show the range of price volatility and future movements.

Advantages of technical analysis
Quick Reaction: Quickly reflect market sentiment and price movements to suit short line traders.
Chart Tools: Using charts and Technical Indicators (such as RSI, MACD), investors can easily identify trends and trading opportunities.
Market Data: Focus on market data, without the need to delve into the financial situation of the company, suitable for investors with limited time.
Flexibility: Suitable for a variety of investment products, such as Stocks, Futures, etc., providing a variety of investment opportunities.
Differences between Technical Analysis and Fundamental Analysis
Apart from technical analysis,Fundamental AnalysisIt is a way to evaluate the value of the company through in-depth study of the financial situation of the company, the industry outlook and the economic environment. By reading the financial statements (e.g.Balance Sheet“Profit and Cash Flow Statement”, and combined with Industry trends and competitive environment, all assess the development momentum of the company.
Technical analysis | Fundamental Analysis | |
Analytical Methods | Stocks Price Trends, Volume and Market Data | Corporate Financial Statements, Industry Outlook, Economic Environment |
Analytical Indicators | Charts, Trendlines, Technical Indicators (such as RSI, MACD, KDJ) | Financial Ratio (e.g. PE,ROE、Industry data |
Suitable for investors | Capture market volatility for short-line to mid-line investors | Long-line investors discover undervalued quality companies |
Trend Type Technical Analysis Indicators
Trend Indicators are used to identify and confirm the trend direction of the market. These Indicators often form single or multi-bar lines on the price chart, helping traders to predict the market for an uptrend or a downward trend.
MACD Index Smooth Moving Averages
MACD IndicatorsUsed to identify price momentum and trend changes. Composed of two moving averages and a bar pattern, it can provide Buy and Sell signals.
Main components
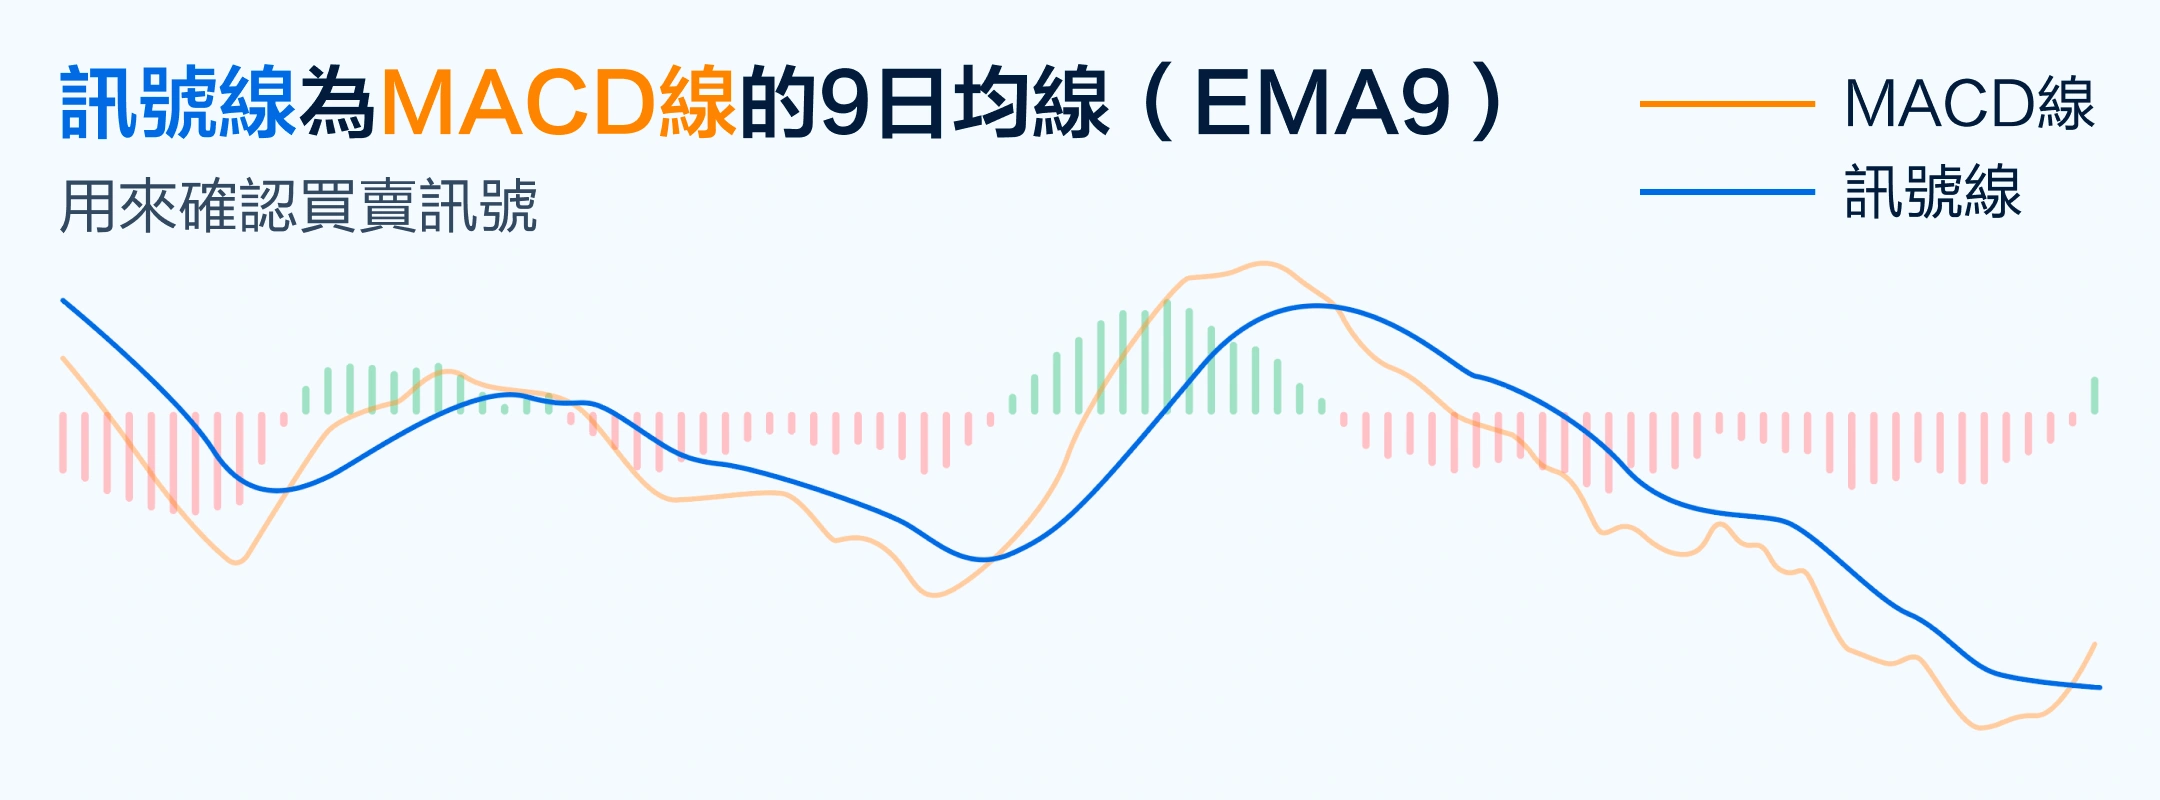
1. MACD Line: Also known as fast line. This line is calculated from the moving average (EMA) of the short term average (usually 12-day) and long line (usually 26-day), reflecting a potential upward or downward trend in the market. When EMA12 is higher than EMA26, the MACD line moves up and vice versa.

2. Signal line: also known as slow line. This is a 9-day moving average, which is the index average of the MACD line.
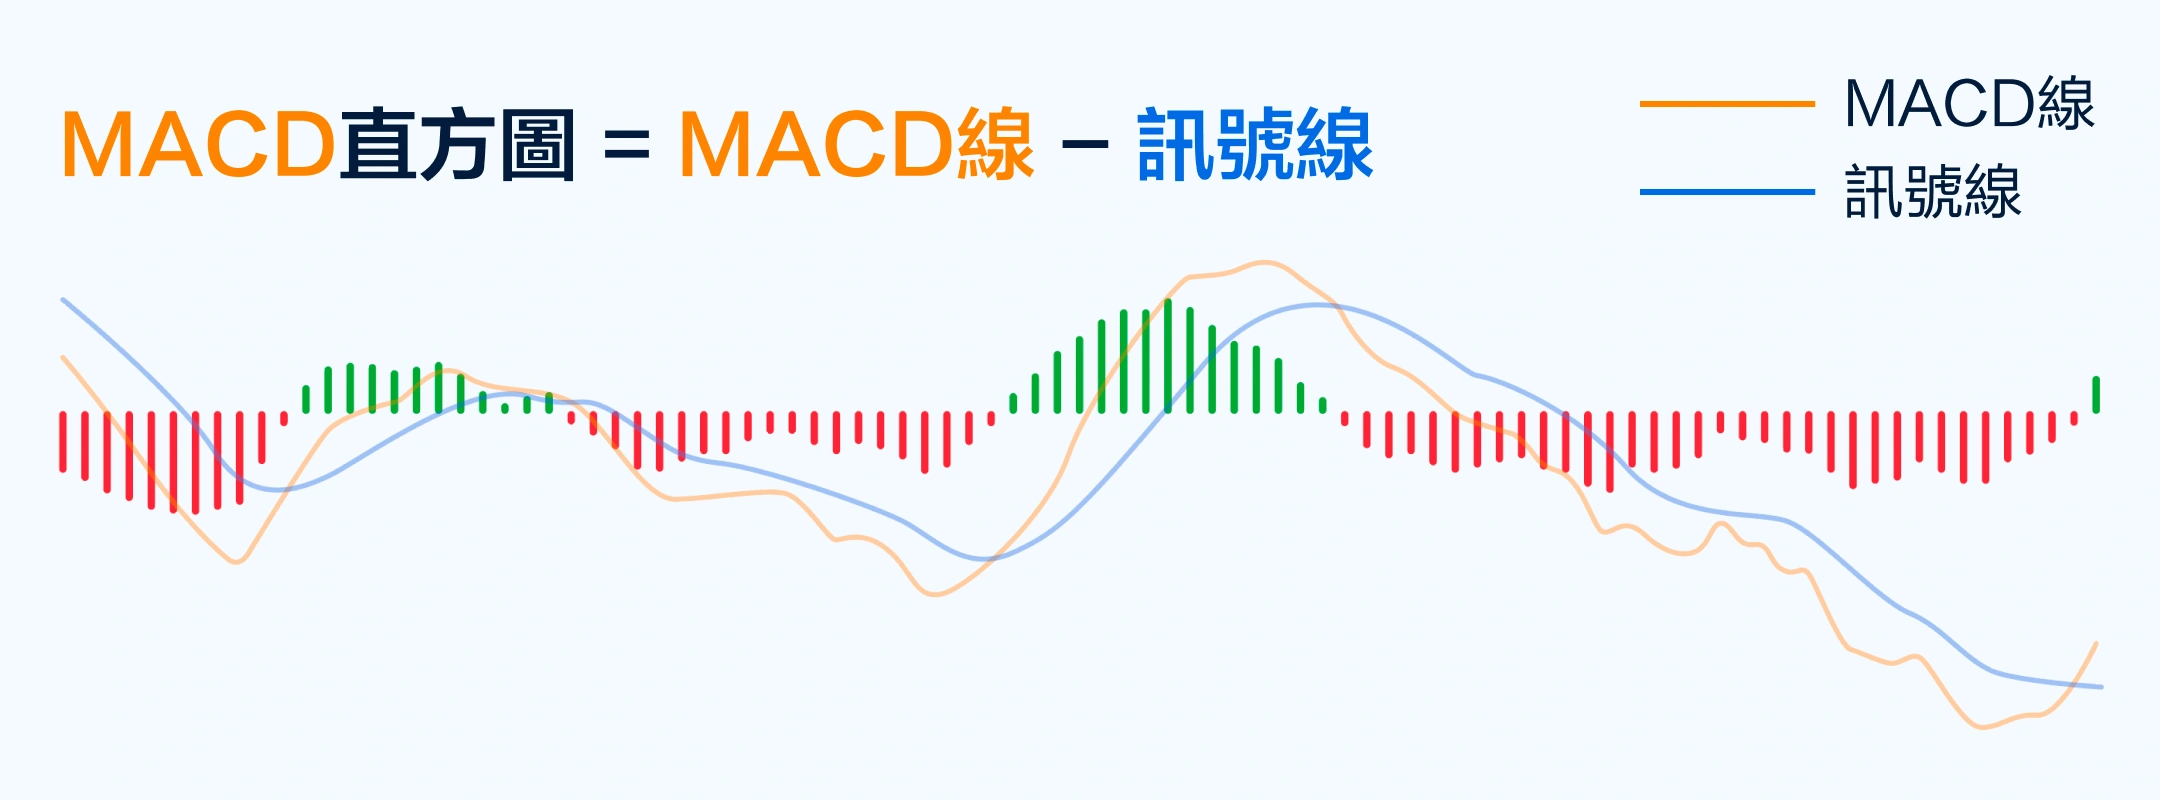
3.Bar Figure: Displays the difference between the MACD line and the signal line. When the column is in the right direction, (Red turns green), indicates a Sell signal when the Buy signal is in the right direction (Green turns red).
Indicators of technical analysis of the type
Volatility Indicators are often more effective in the benchmark market, and they are used to identify overbought or oversold states to predict a dip in reversals.
KDJ Random Indicators
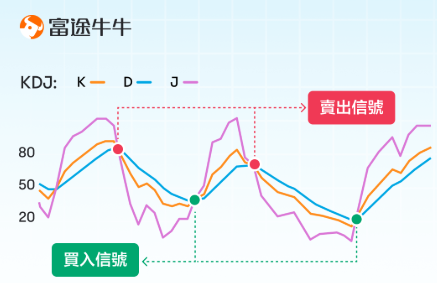
KDJ IndicatorsIdentify price momentum and trend changes. It is composed of three lines: Candlestick, D line and J line. Help investors understand the buy and sell conditions of the market and provide Buy and Sell signals.
Main components
Candlestick: This line reflects the movement of the price in the near term and usually changes quickly. When the Candlestick crosses the D line upwards, it indicates that the price may rise, is a Buy signal.
D line: The D line is the smooth line of the Candlestick, which varies in length and is able to filter out some short-term vibrations. When the Candlestick breaks down the D line, it indicates that the price may fall, is a Sell signal.
J Line: Displays the difference between the Candlestick and D line based on the calculation of the line and the D line. The J line has the fastest rate of change and can predict price changes in advance.
RSI Relative Weak Index
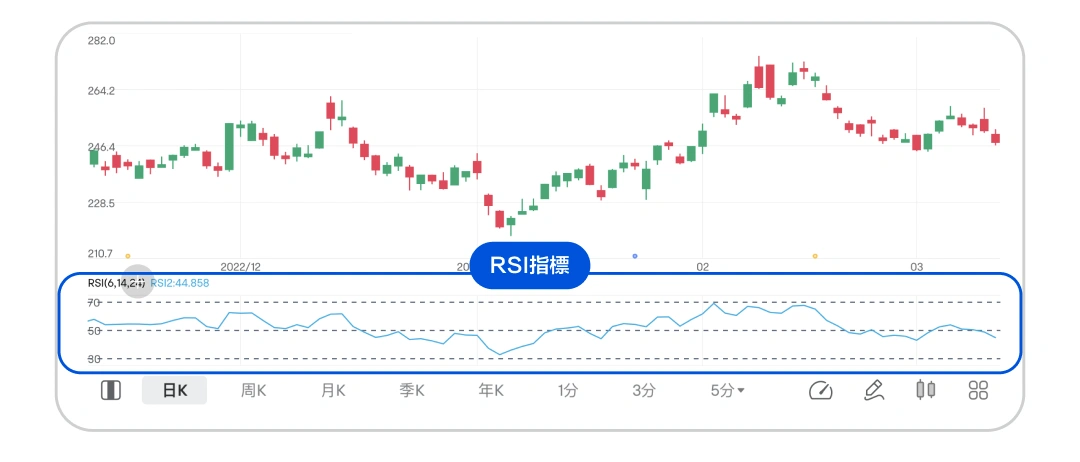
RSI IndicatorsBalance the relative strength of the price curve by calculating the ascending and falling ratios of the internal price over a period of time. The value of the RSI fluctuates between 0 and 100. Investors can observe the relationship between RSI Indicators and price trends to discern the timing of a dip in sentiment.
How to Use RSI Indicators
Overbought and oversold: When the RSI is above 70, it indicates that the market may overbuy, the price may rebound; when the RSI is below 30, it indicates that the market may oversell, and the price may rebound.
Trend Change: Changes in RSI can help investors identify changes in price trends and make smart trading decisions.
Withdrawal signals: When the price movement is in reverse with the RSI, it is often a sign that the trend may be reversed, which is a signal that investors need to pay special attention to.
Williams %R William Indicators
William Indicators (WMSR)It is used to balance the buy and oversell conditions of the market. The William Indicators range from 0-100 to help investors understand the short-term trends in the market.
How to Use WMSR Indicators
Overbought and oversold: When the value of the Halal Indicators is higher than -20, it indicates that the market may overbuy, the price may revert to the current value below -80, indicating that the market may be oversold, and the price may reverse.
Backward Signal: When the price trend is opposite to that of the William Indicators, it is called back. This usually predicts that the trend may soon reverse. For example, when the price innovates high and the William Indicators cannot innovate high, it may be predicted that the price will fall soon.
Technical Analysis Indicators
If you want to be more accurate in the market direction, you need to spend a lot of time researching and analyzing different Technical Indicators, which may be difficult for new investors at first. Futubull's members of Futubull's members are able to quickly integrate their shareholders' value-related information, news and trends to help improve investment strategy efficiency and experience!Click here to learn more >>>

Volume Technical Analysis Indicators
Volume Indicators Analyze the Market Analyze Market Volume of the market to measure the strength of market activity and fluctuating price movements.
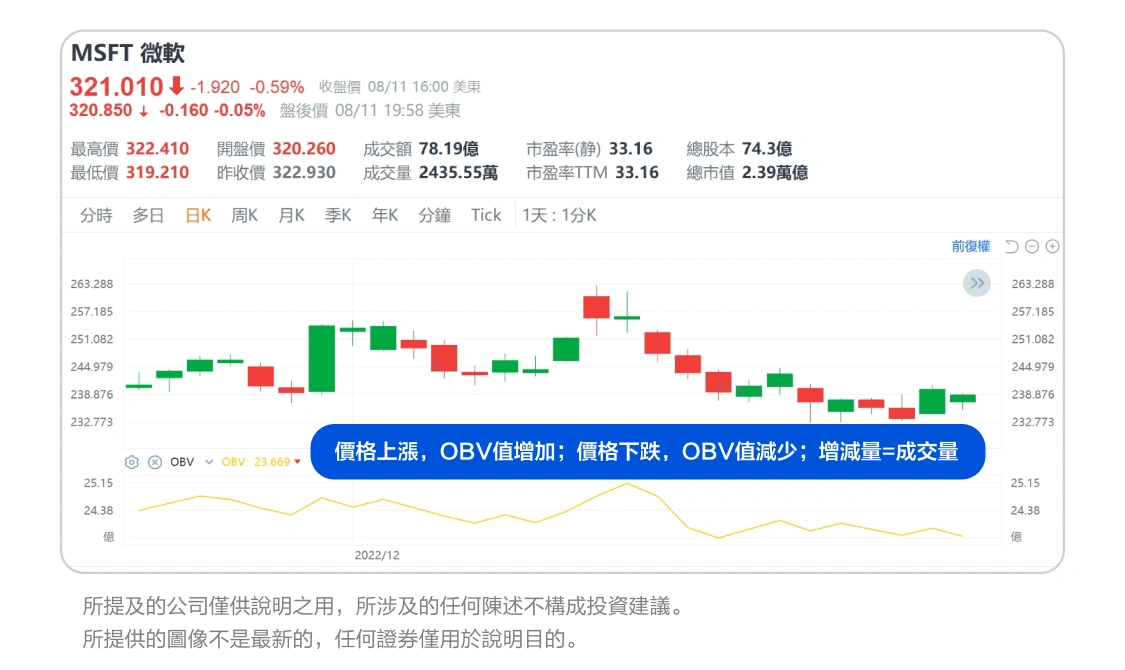
OBV Accumulated Energy Line (On Balance Volume)
OBV IndicatorsUsed to predict market trends by evaluating the relationship between Trade Volume and Price.OBV IndicatorsIt is a volume value that changes the rise of the price in another direction. When the price rises, the current volume is added above the OBV value, and when the price falls, the current volume decreases from the OBV value. The core of OBV Indicators is subject to change in trend, rather than neutral. When OBV and the price trend are in line, the current trend may be extended, and when OBV and the price trend is backward, the forecast trend may reverse. The OBV shows the increase in the purchasing power, and the decrease in the level of the increase shows the increase in the sales force.
Volume Weighted Average Price for VWAP Trade
VWAP IndicatorsIt is used to measure the average price over a period of time, and consider the impact of the trade volume. VWAP is usually calculated in one trading day, from market opening to taking. WHEN THE PRICE IS HIGHER THAN VWAP, THE MARKET IS ON THE UPTREND WHILE THE PRICE IS LOWER THAN THE VWAP, THE MARKET IS ON THE DOWNTREND. VWAP can be used as reference entry and offsite points, such as Buy when the price is below VWAP and sell when the price is higher than VWAP.
Oscillation Technical Analysis Indicators
Volatility Indicators measure the volatility of market prices, helping traders to identify market risks and trading opportunities.
BOLL Bollinger Band
BOLL IndicatorsHelps to balance the volatility range of market prices, and helps investors identify market trends, resistance and resistance levels.
Main components
Medium Line: Usually it is a 20-day average (20MA).
Up and down rail lines: 2X the standard difference for the middle rail line, respectively. The standard deviation measures the degree of dispersion of the data relative to its mean.
ATR Average True Range
ATR IndicatorsIt is used to measure the volatility of market prices, but does not reflect the upward and downward direction of the price. Higher ATR values indicate greater market volatility; lower ATR values indicate less market volatility. Investors can set stop loss points based on ATR values to respond to market fluctuations, such as setting a larger stop loss point when the ATR value is higher and a smaller stop loss point when the ATR value is lower.
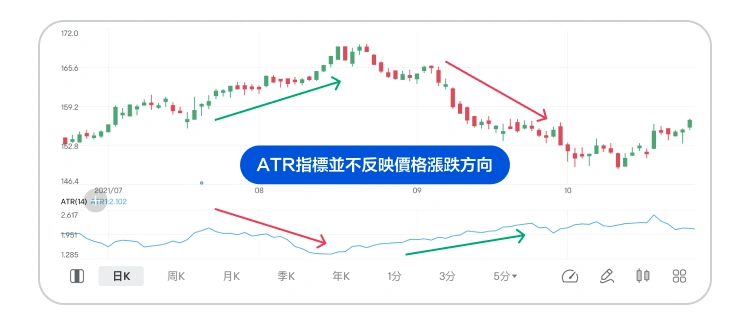
From now on, ATR Indicators can help determine the strength of the trend. When the market is in a strong trend, the ATR value usually rises, the market usually rises above the plate level, and the ATR value usually goes down. Using ATR Indicators, investors can increase the dipping volatility range of the daily price and define a stop-loss strategy in a more effective manner.
Free Stocks Technical Analysis Software Recommendation
Painting lines and analysis require a lot of time and accuracy. There are now investment apps with different Technical Indicators and painting tools that are free to use for investors, such as Futubull, which can change their time and increase their profitability. Futubull Futubull not only provides a large selection of technical indicators, but also TechnicalIndicator and chart functions, but also7x24 hour news flashHelps investors better understand market dynamics and make smarter investment decisions.
Futu not only offersOver 105 Technical IndicatorsAnd 45 Drawing Tools, More AI Automatic Painting, Trend Prediction and Technical Analysis Tools to help you capture the time to trade!

Teaching Technical Analysis of Hong Kong Stocks
wantInvest in Hong Kong stocksAnd you can use technology to analyze the movement of Hong Kong stocks! In past articles,Chief Analyst of Futu Chili (Arnold) It shows how to use Technical Indicators to analyze Hong Kong stock movements, but to warn investors not to go over technical indicators such as KDJ or RSI.
Extended Reading
[Hong Kong Stock Analysis] Is it Ultra Thai? Analysis of Hong Kong Stock Trend in 2025[Technical bull market] Hong Kong stocks have risen in a row. How can investors respond to the bull market?
[Technical rebound] Hong Kong stocks can keep an eye on at the moment
