2026 Latest Investment Lazy Bundle
Robo Advisor VS AI Investment Assistant | Smart Investment Platform Recommendations

What is Robo Advisor?
Robo-Advisor is a fully automated investment advisory service that automatically configures and manages portfolios through algorithmic and AI analysis of users' financial situation, risk tolerance and investment objectives. Compared to traditional banking advisors, Robo Advisor has lower thresholds, no time constraints, simple operation, and is suitable for busy investors.
Difference between Robo Advisor and AI Investment Assistant
Robo Advisor provides automated, personalized portfolio management that utilizes simple algorithms to track and automate portfolio adjustments
AI INVESTMENT ASSISTANTS USE ADVANCED AI TECHNOLOGY TO ANALYZE REAL-TIME DATA TO PROVIDE PERSONALIZED, DYNAMIC STOCK DEPTH READINGS FOR INVESTORS SEEKING FLEXIBILITY.

Robo Advisor
How it works: Robo Advisor provides objective configuration advice based on the user's financial needs, investment preferences and risk tolerance, and regularly offers repositioning advice. Investors provide personal information (such as investment amounts, methods, and risk preferences) through smart surveys to allocate assets and regularly improve portfolios using the Auto-Rebalancing Mechanism to maintain risk ratios without being influenced by market sentiment or key factors.
Advantages: Robo Advisor provides diversified, personalized, intelligent and automated investment solutions. Low thresholds, automatic rebalancing and cost transparency make investments more efficient and time-saving.
Limitations: The validity of the model depends on the accuracy and reliability of the data used. Inaccurate or incomplete data can lead to adverse investment decisions, while managing multiple factors increases the complexity of the investment strategy, making it more difficult for investors to understand and monitor. At the same time, there is a risk that models and historical data are overmatched and may not accurately predict future market conditions, and the effectiveness of the relevant recommendation strategies is limited.
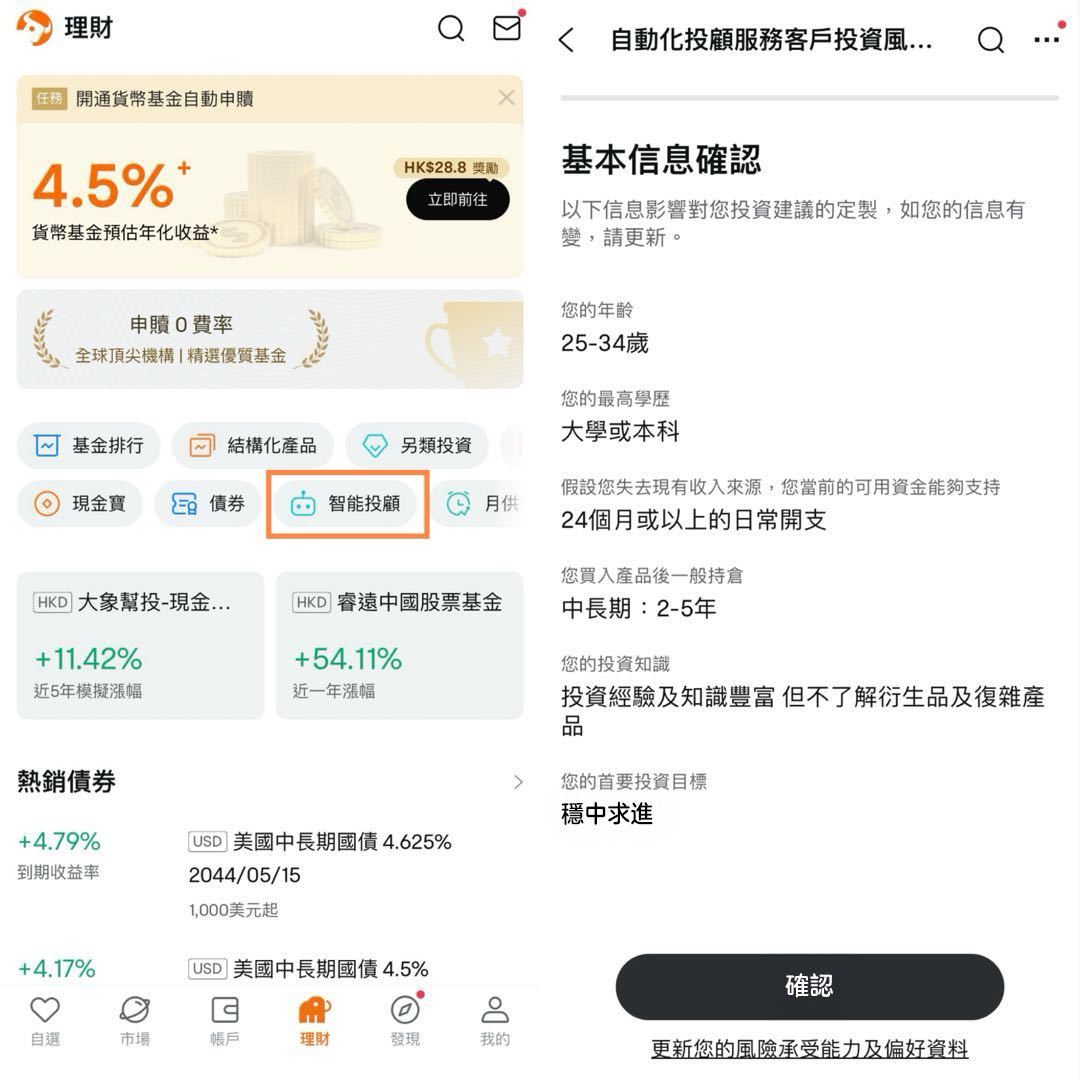
inFutubull, you can click on [Banking - Smart Investment], fill in the basic information and investment risk tolerance and preferences, and you can start using Robo Advisor! Regarding Robo Advisor fees, you canClick hereLearn more.
AI Investment Assistant
Deep Learning Analytics: Use AI technology to analyze market trends, real-time data, news, market sentiment, interpret performance data, and more and provide reference data for dynamic adjustment strategies.
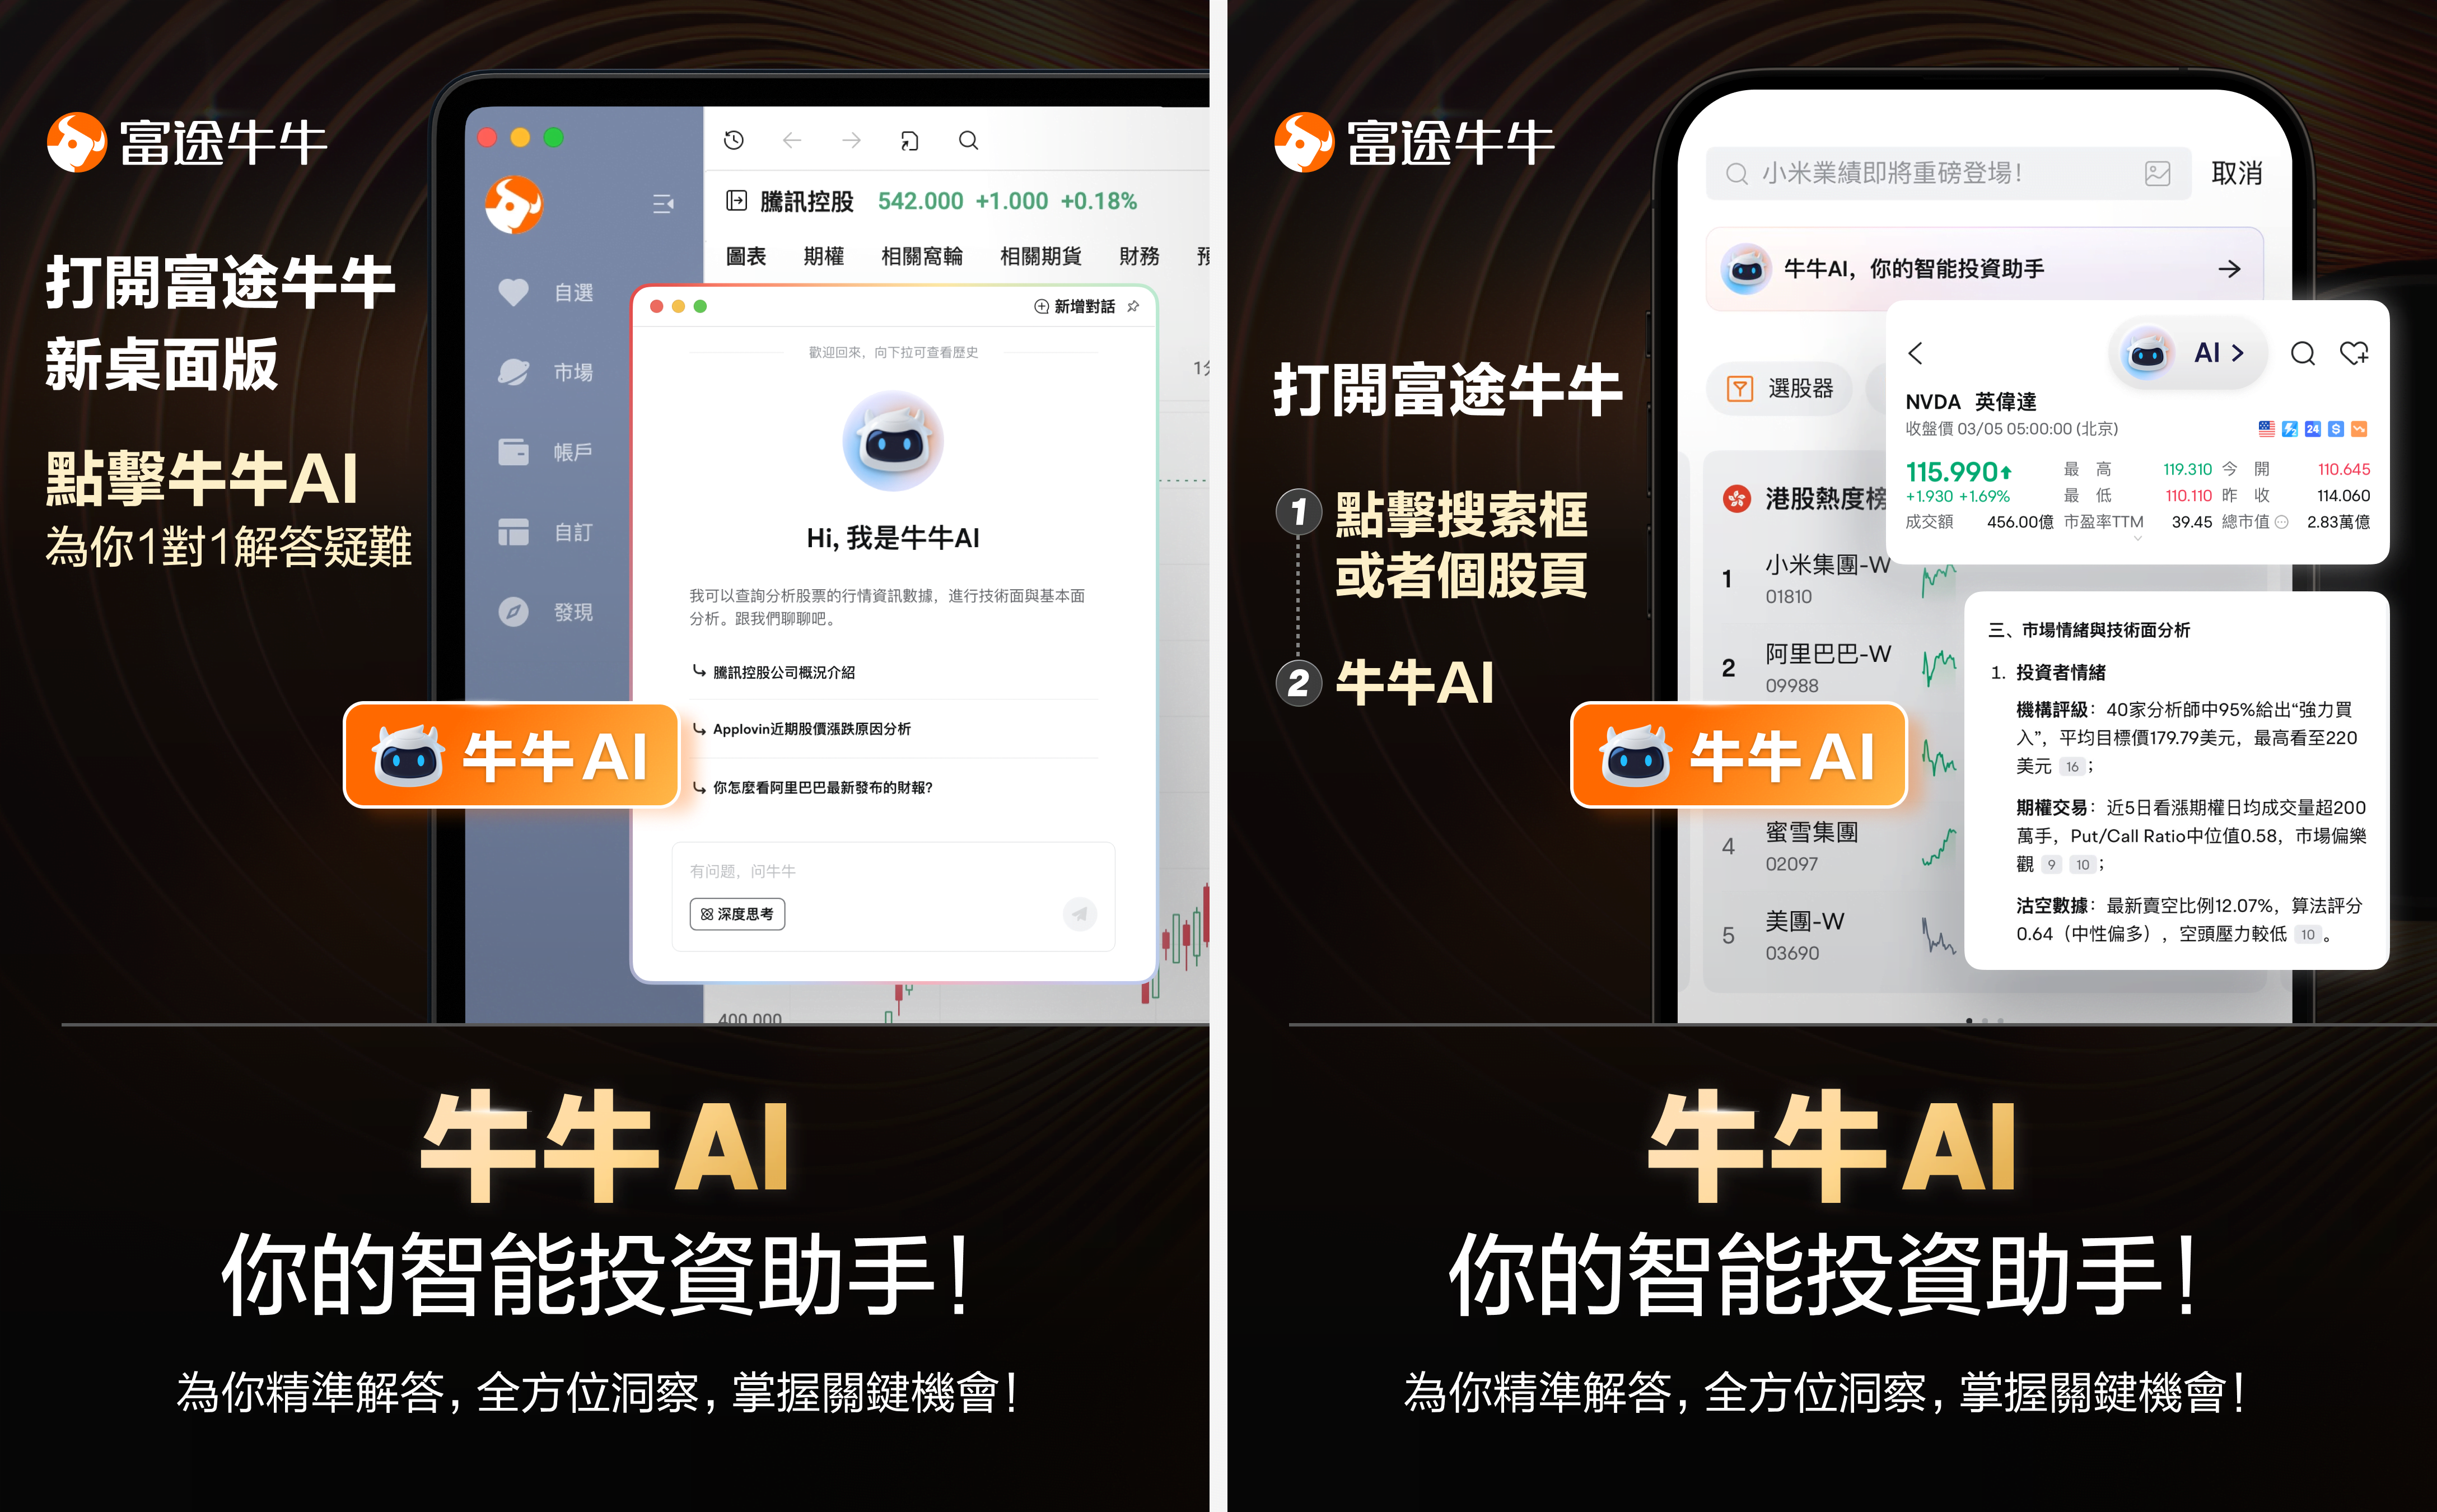
One Stock Reading and Strategic Suggestion: Futubull New Feature【Futubull AI adopts DeepSeek technology, provides instant response to user inquiries, AI stock readout analysis of the company's foundation and highlights technical signals, and AI Smart Plan line up automatic trend chart status!
Hong Kong Smart Investment Platform Recommendations
In the era of AI, Futubull, the smart investment platform Fubu, took over as the owner of Robo Advisor, and Birobo Advisor became more active.
Futubull AI based on AI model capability integrationHong Kong stocks、US EquitiesOther markets and trading categoriesTechnical sideundBasic FacesInterpretation is used by beginners to advanced users. Based on a preference for different stock interpretation methods, consider using different AI tools for reference:
Message+Basics:【AI Q&A】
Technical side: [AI automatic drawing] + [AI technical interpretation]

Futubull AI Functional Analysis
In the content of Futubull AI's reply, much of the description comes with numbers. Click on these numbers to take you to many of the features pages of the Futubull App, or to the content of the information, the Bullring discussion. Included in the above content are the functions of financial aspects, technical indicators, as well as affective data, sales data.
Financially, it includes not only the three main statements for individual stocks (profit and loss statement, balance sheet, cash flow statement), but also quarterly operating data, as well as financial forecasts on operating income, earnings per share, and profit before interest taxes. These data features are essential for analyzing the financial condition of a stock and forecasting its future performance, and can be found through the individual stock details page > Company > Finance.

Technical indicators are mainly the Indicator Interpretation feature. For some cattle lovers, it may not be so easy to look at various technical indicators and then make a judgment, at which point you can consider using this feature to get some signal references (you can set three different time cycles of 1 day, 1 minute, 60 minutes), which seems very intuitive and convenient. This feature can be found on the individual stock details page > Path to the analysis.

The Sell and Sell Data Analysis function shows the daily short-selling volume of a stock, daily undersold ratio, number of empty positions, and empty holding ratio. The higher the short sell data reflects the stronger the sentiment, and the lower the data, the opposite. This feature can be used to identify empty sentiment in the market and help determine stock price movements, which can be found on the Share Details Page > Path to Analysis.

How do I get started with a smart investment platform?
No doubt AI is an investment tool or smart investment advisor (Robo Advisor). Futubull may suit your needs!OPEN AN ACCOUNT NOWExperience【Futubull AI function! Start your smart investment journey by taking advantage of the Time Opening Rewards!
Head over to Futubull and sign up for a new account.(Register now)
Simply open a comprehensive account and deposit funds to trade global markets, including Hong Kong stocks and US stocks. Click now to open in Futu, with new customers delivering up to CZK reward. Hong Kong shares are free!*Offer subject to terms and conditions.

From Theory to Practice: AI Investment Tools Real-Life Case
To help people better use the Futubull AI, we offer a series of lessons for our students. Let's take a look at how Futubull AI can help us with our investments.
Find focus points after results
When a company publishes results, we first want to find out what the performance is like now and if it is on schedule. The next question is what to see after the market, which requires a lot of factors and analysis, and we can ask Futubull AI directly.
The design images displayed on the screen are for illustrative purposes only and do not constitute any investment advice or guarantee.
For example, when we ask:
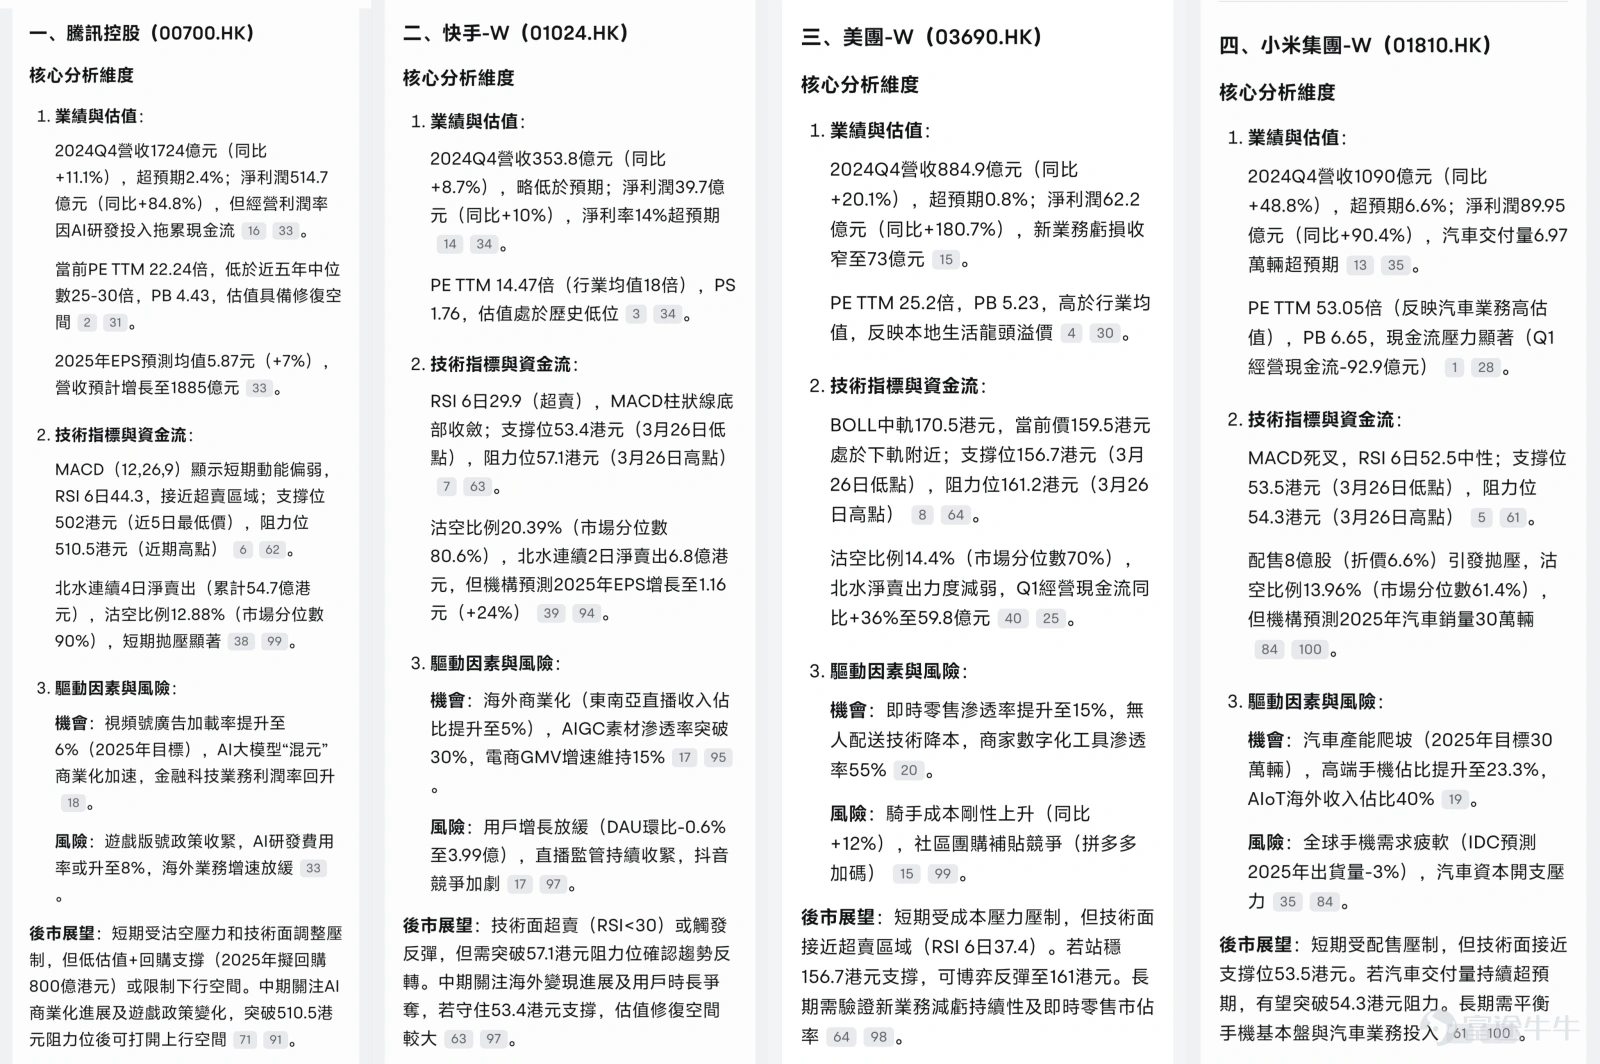
In the recent Hong Kong stock market, $ STARTER -W (01024.HK) $ 、 $ US GROUP -W (03690.HK) $ 、 $ Xiaomi Group -W (01810.HK) $ 、 $ Tencent Holdings (00700.HK) $ Results have been published. How do the latest results of these four companies compare to expectations?
Futubull AI has a partial answer:
Comparison of actual and expected values of core financial indicators, business highlights, key metrics.
Above Expected, Below Expected Indicators and Market Reaction.
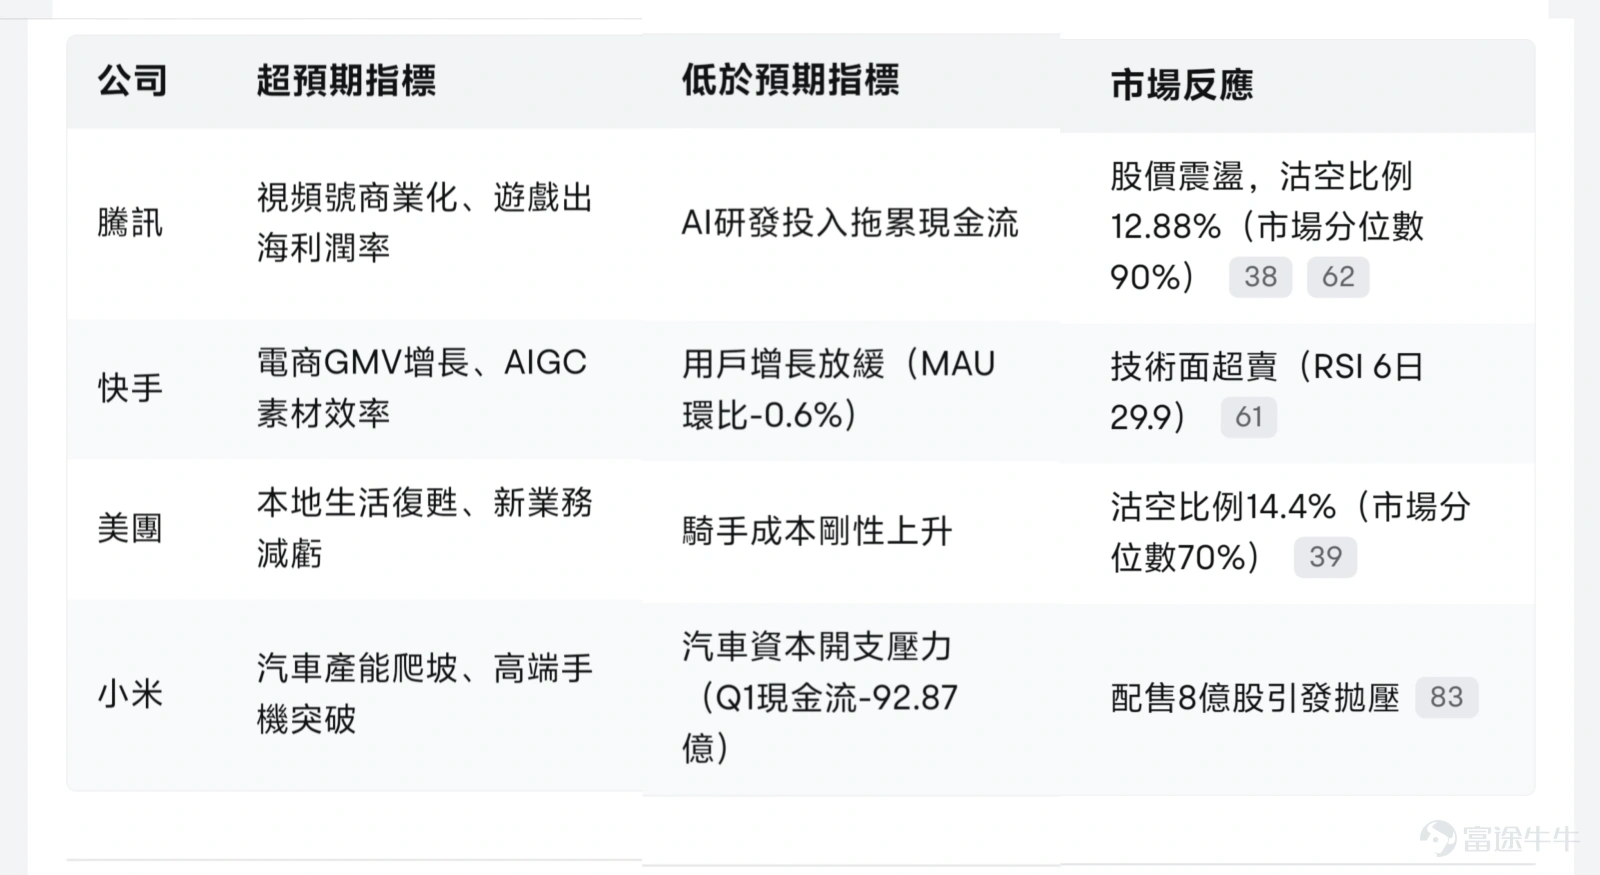
Opportunity factors, risk factors and comprehensive conclusions for the post-market are also given.
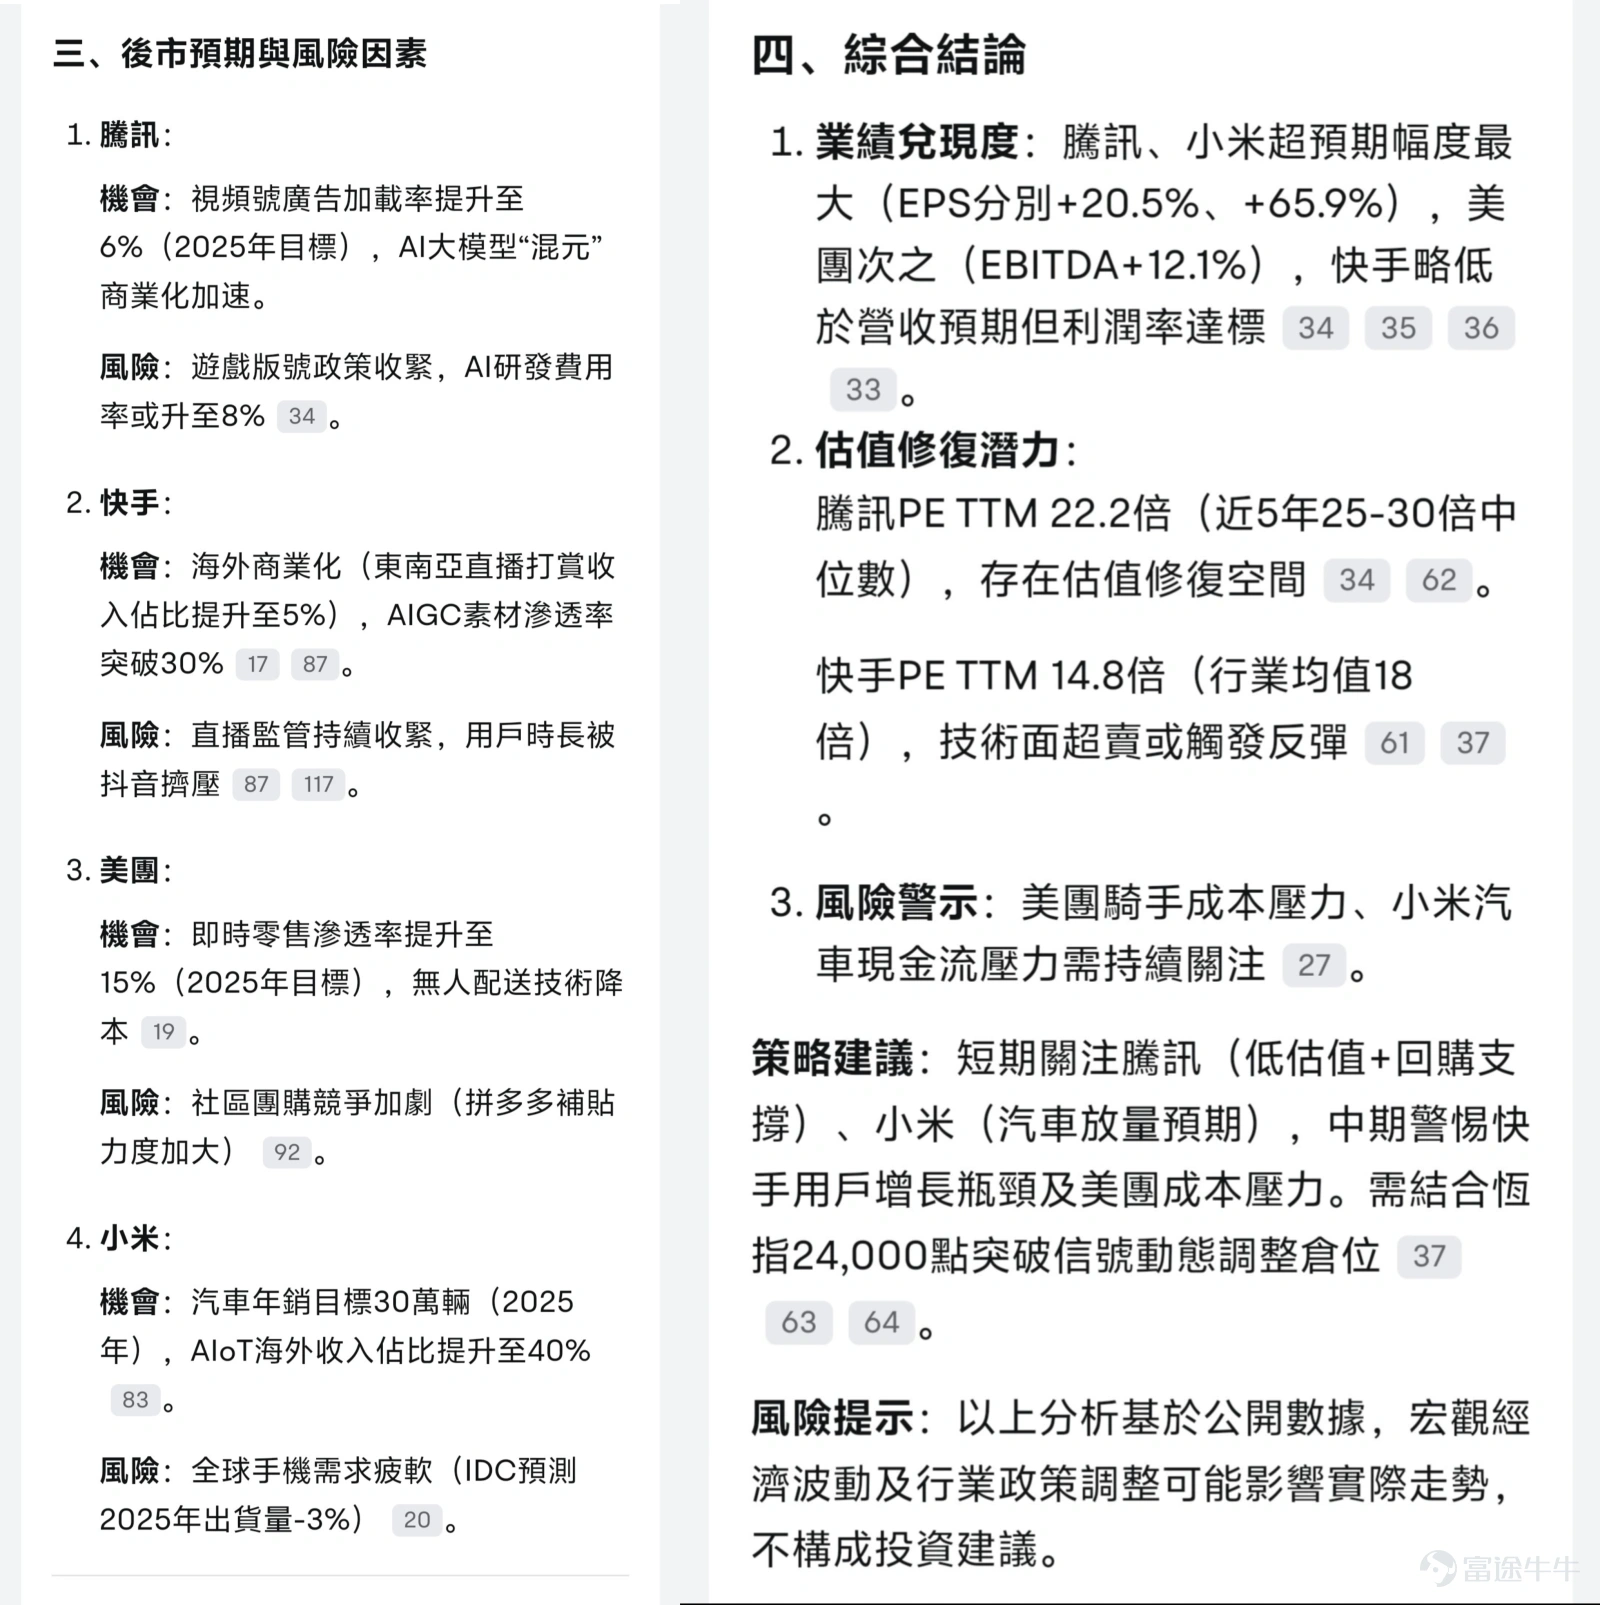
Futubull AI provides fundamental analysis and insight into the recent performance of many companies and market expectations, as well as related opportunity factors, risk factors and market reversals.
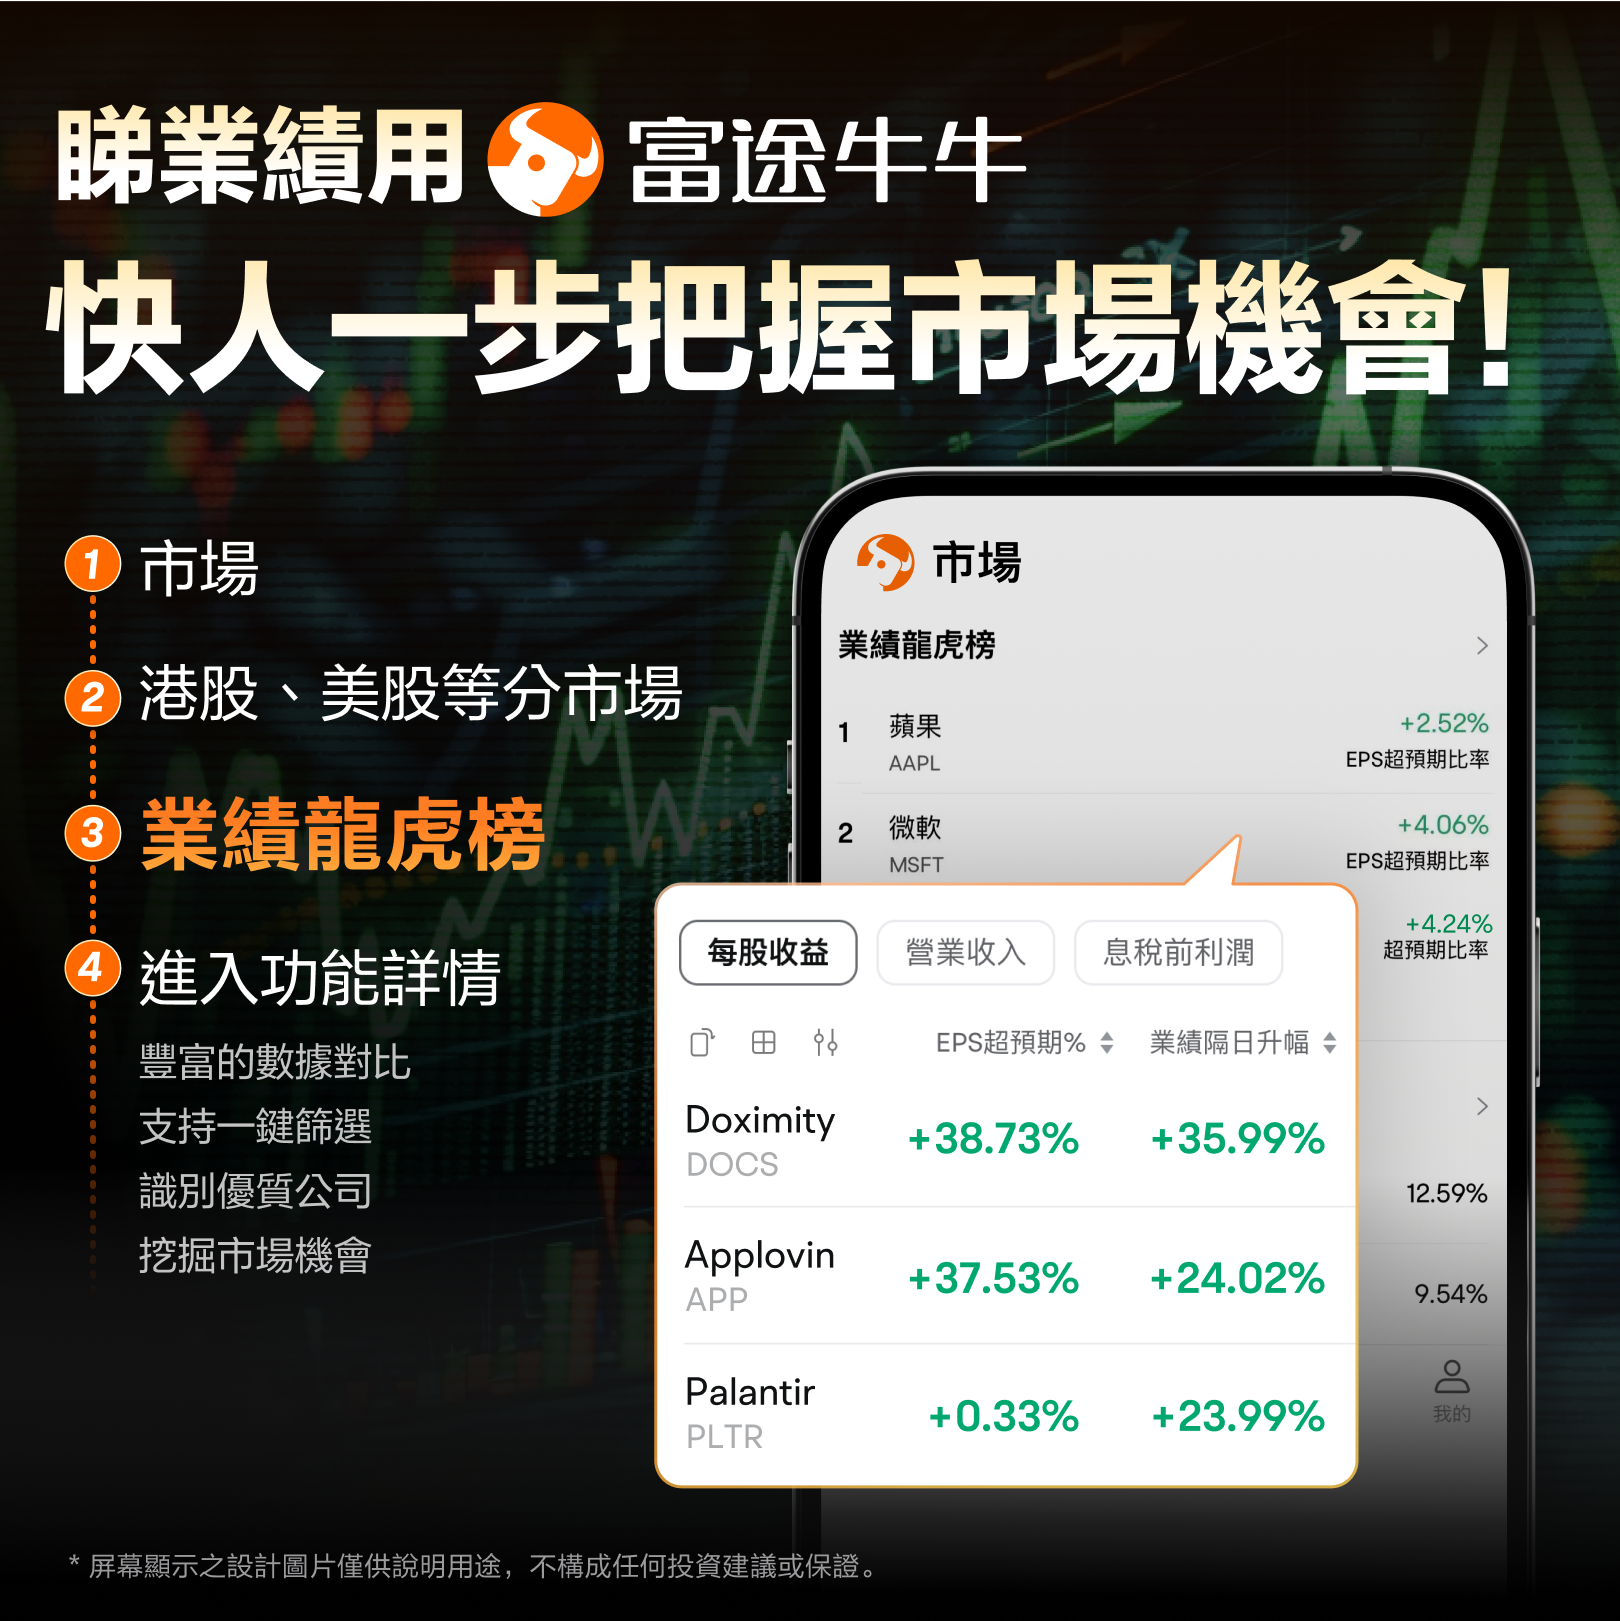
Do you want to see a company that has achieved faster results than expected? Futubull's“Results Dragon Tiger List”It will help you to see clearly at a glance!Download and experience now, Capture more investment opportunities!
System Analysis After Market Trends
At the same time, we see that Futubull AI is lagging behind the market in an attempt to recover from the value correction. Please ask again not only about after-market issues, or if we can incorporate more information again:
Combining detailed information such as performance, valuation levels, technical indicator signals, support and resistance levels, recent trading volume and capital flows, key drivers and risk factors, respectively, technical and fundamental analysis of their post-market movements.
When we have a general understanding of the fundamentals, technical and financial aspects of these stocks, as well as some references to their post-market movements, it is easier to make decisions about whether or not to operate the stocks in the future.
Analyzing Core Financial Indicators Using Futubull AI
At the coreFinancial IndicatorsIn its analysis, the Futubull AI focuses on revenue and net profit, which are two of the most important indicators in the performance analysis.
Revenue reflects the company's business size and market performance, while net profit is a direct reflection of the company's profitability. When you look at these data, you don't just look at what they're worth, but also see if they're growing, how much they're growing compared to the same period last year, and how they compare to market expectations.
If there is significant year-on-year growth, or significantly above expectations, it may be favorable, and vice versa, downwards or less than expected. However, it is also important to see specifically what is the cause and understand in detail what the business has changed and what has changed.
And the data analysis of business highlights, mainly from operating data, and the focus is different for each company. For example, for Tencent, the number of active users is very important. In addition to the number of active users, it also needs to pay attention to the total GMV of merchandise transactions, and Xiaomi needs to pay attention to the volume of shipments.
In terms of performance and market expectations, Futubull AI is importantEPSand EBIT of profit before interest tax.
EPS: A company's net profit divided by the total share capital, is a direct representation of the profitability of each share. It can be easier and more straightforward to understand the impact of a company's performance on shareholders.
EBIT: Excluding the impact of interest and taxes, it directly reflects the profitability of the company's core business.
So the market is usually predictive of these two indicators, and by comparing these forecasts and actual values, when the actual value is higher than the forecast value, it can be advantageous, and vice versa, it can generate stress.
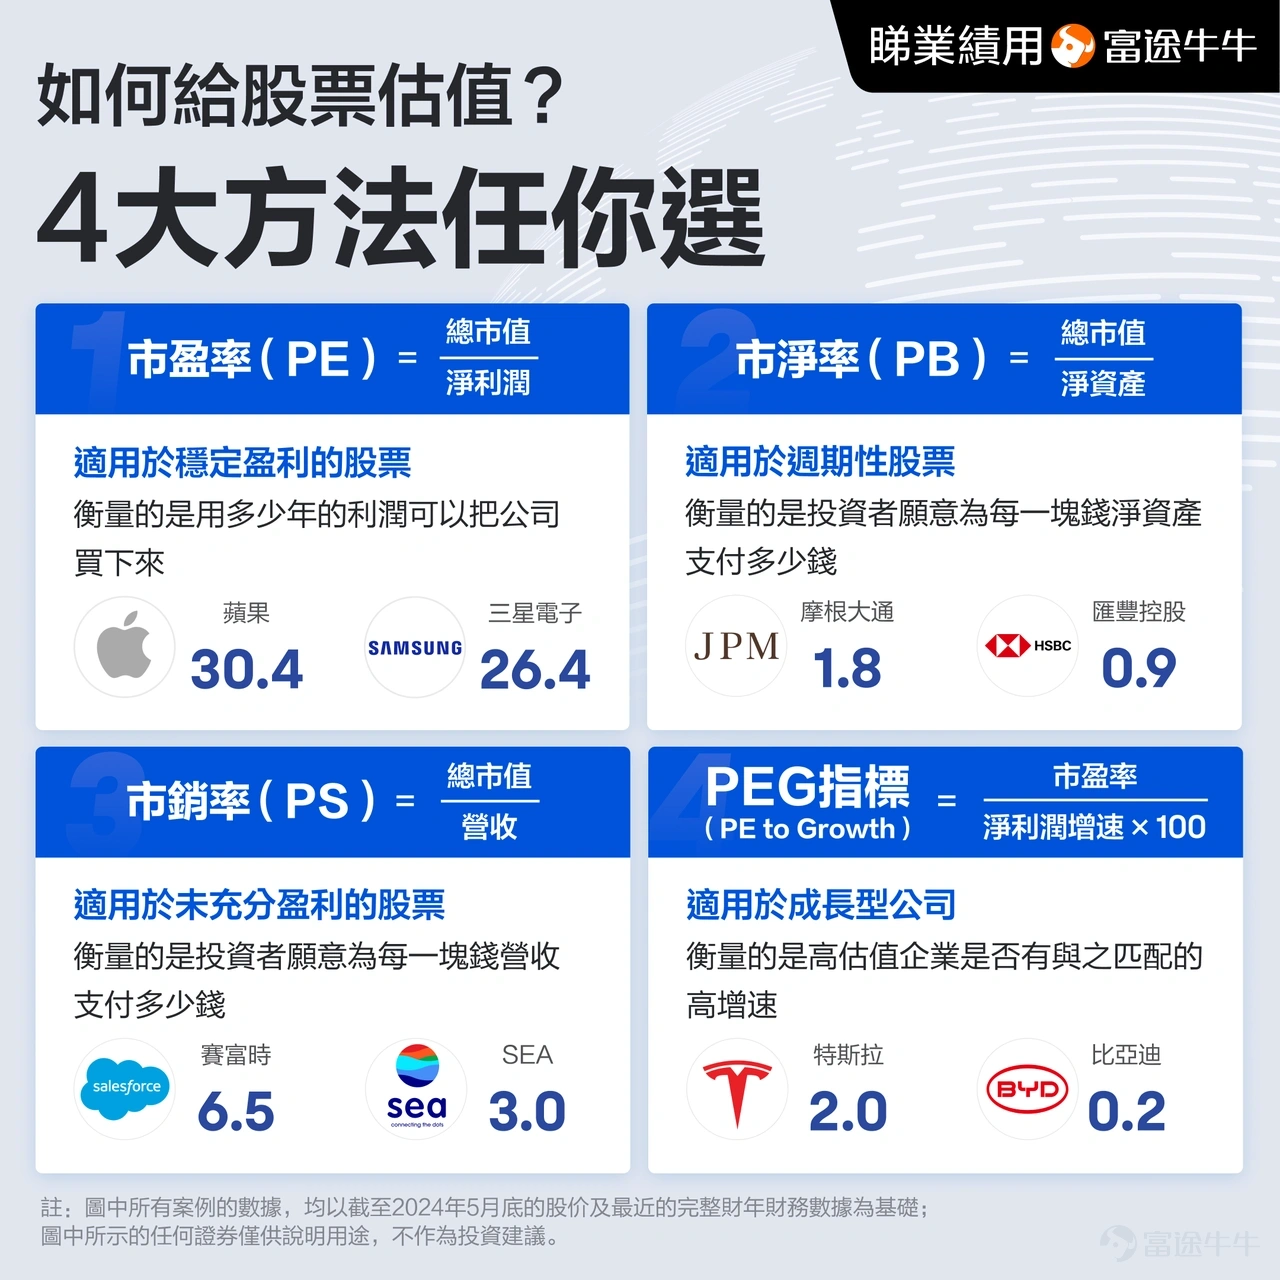
Let's say again.Company Valuation,Futubull AI mainly refers to these three value indicators: PE, PB and PS. These are very common value indicators, the applicable ranges are not the same, the tool body's content and the applicable range can be seen below.
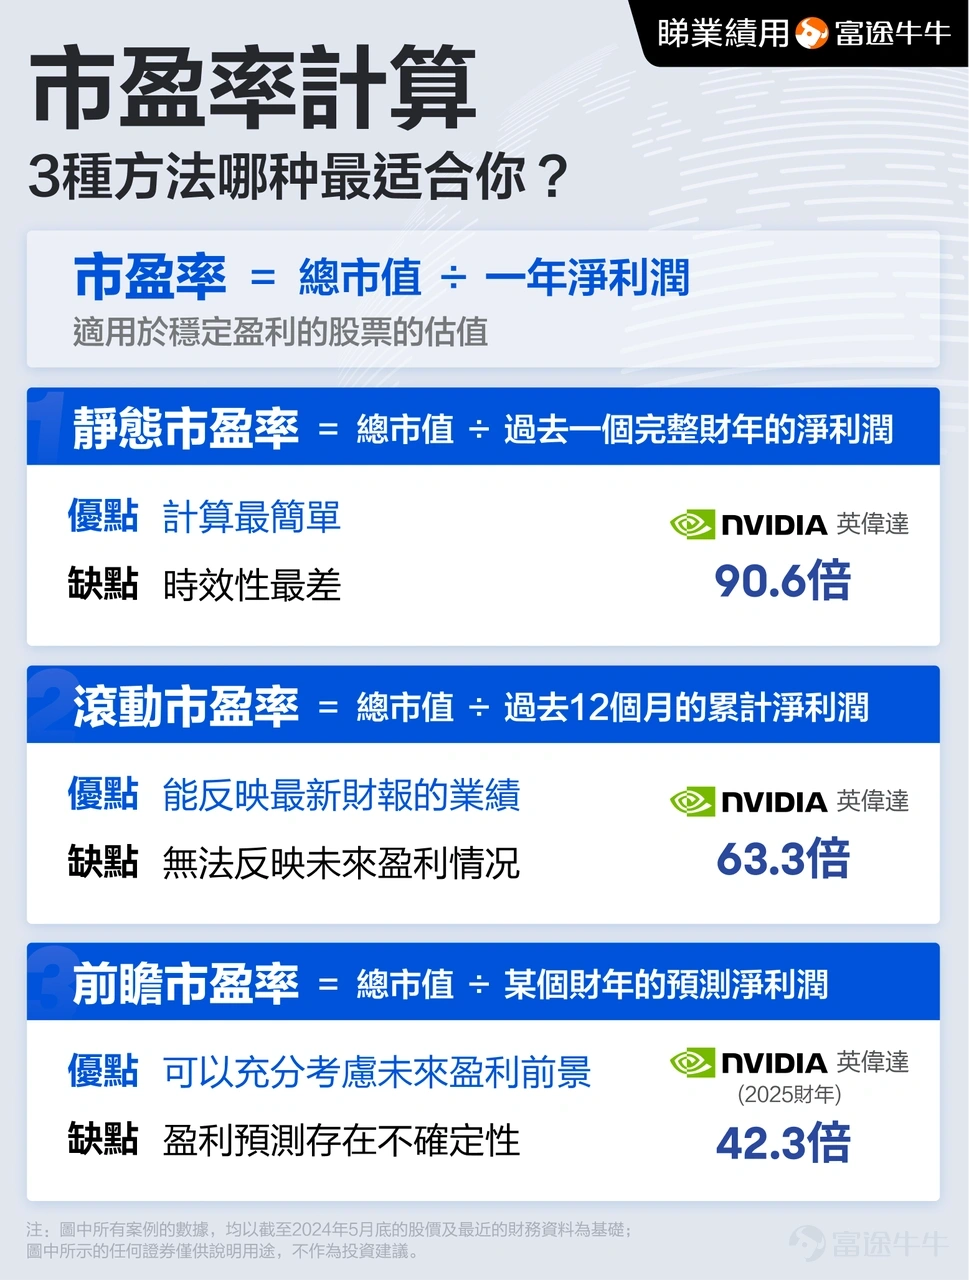
TTM after PE means: This is a rolling market rate of profitability. Here, by the way, we explain the three different methods of calculating market profitability and their advantages and disadvantages:
For valuation levels, in addition to looking at valuation values, it is also necessary to compare current and past values longitudinally and to compare laterally with industry averages to see where they are in order to more accurately determine whether they are overvalued or undervalued.
Fast technical analysis with AI
Looking at the technical indicators aspect, Futubull AI mainly signals about MACD, RSI, and BOLL, which are three indicators that are used very often in investment practice, and are combined to achieve better results.
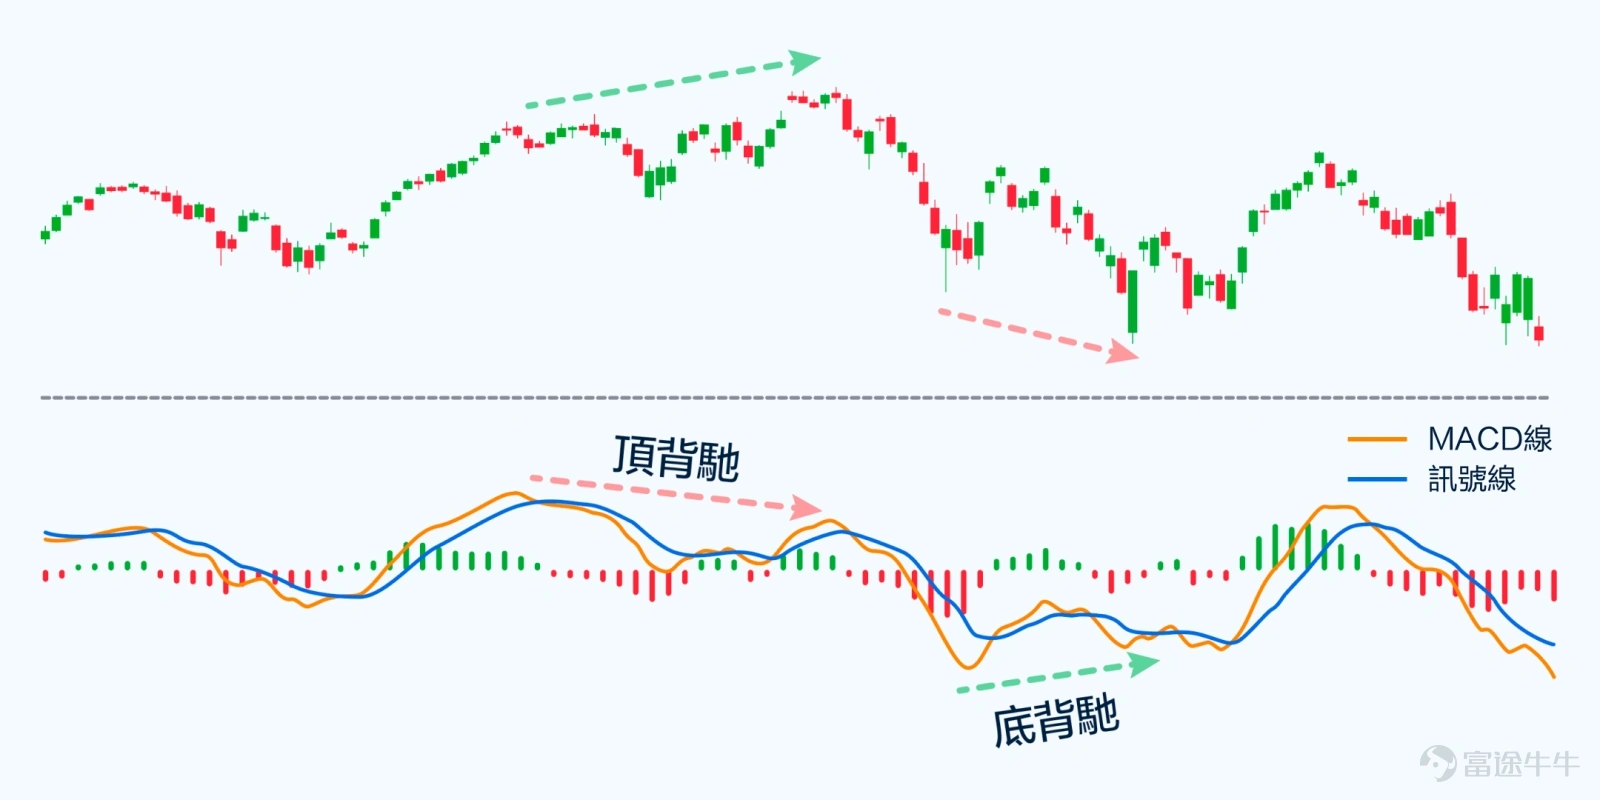
MACD(Moving Average Convergence/Divergence, Chinese name for “index smooth heterogeneous moving average”) is widely regarded by the market as the “king of technical indicators”. It reveals the market's dynamic trends and possible pivot points by calculating the difference between the short-term and long-term index smooth moving averages. There are two major strategies on the app: cross strategy and backslide strategy.
The cross strategy includes two situations called “golden cross” and “dead cross”. When the MACD line (fast line) crosses the signal line (slow line) from below to the top, it forms a fork. At this time, the column chart changes from negative to positive, and the color from red to green (assuming green rises and falls), which is often interpreted as market dynamics being strengthened by weakness. A bullish wave may be imminent, thus forming a buy signal. The dead fork is the opposite (slow line goes down through the fast line).
Unlock Future Investment Course, Learn How to Use MACD Indicators

The rear-wheel drive strategy consists of two forms of backstroke and top-back Mercedes. The downside is that the price continuously creates new lows, while the MACD line (fast line) fails to create new lows and even shows an uptrend, at this time the market may show a rebound, a potential signal to buy. The opposite is true at the top.
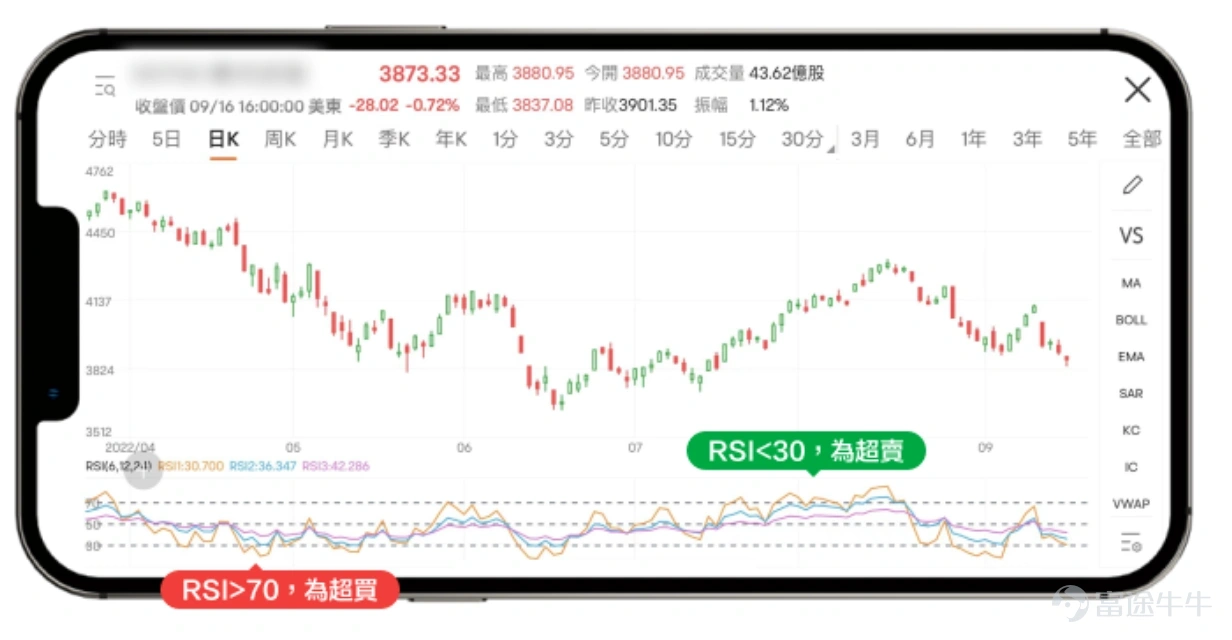
Let's just say it.RSIundBALL。 If the MACD is better suited for judging long-term trends and dynamic changes, then RSI is better suited for assessing short-term overbought or oversold conditions. It is often thought that when the RSI is above 70, it may prompt overbuying and there is a risk of a reversal of the fall; when the RSI is below 30, it may prompt the market to overbuy. Sell, there is a chance to reverse the rise. Similar to the MACD, the RSI can also use both backstroke and top-back trading strategies.Unlock Future Investment Course and learn how to use KDJ metrics
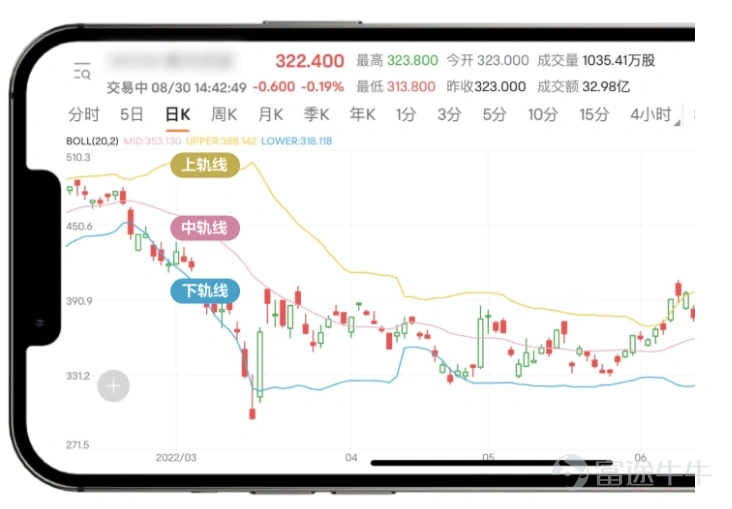
BOLL CAN BE USED TO ASSIST CONFIRMATION, WHETHER IT IS USING MACD TO DETERMINE LONG-TERM TRENDS OR WHEN USING RSI TO DETERMINE THE CONDITION OF SHORT-TERM OVERSELLING. THE BOLL LINE HAS THREE LINES: UPPER TRACK, MIDDLE TRACK AND BOTTOM RAIL. The upper track can serve as a resistance level, which prompts an overbuy signal at a break; the lower track can serve as a support level, and an oversell signal at a break. When the stock price runs above the midline, it signals a short line strength movement; when the stock price runs below the midline, it signals a short line weakness phase.
Research Bid Ratio and Market Segmentation
In the example of Futubull AI above, we refer to the gap ratio and the market segmentation, for example, the gap ratio 14.4% (market share number 70%). This talk shows that currently the number of shares with this gap is 14.4%, and for 70% of the time in history, the number of shares in the past The vacuum ratio is below this level, so the current sales pressure is comparable.
