Top US Stock Results Interpretations
[Performance Report Guide] Understanding Financial Statements in One Breath
The publication of results of Hong Kong listed companies is mainly concentrated in March and August of each year. Annual results announced in March provide a comprehensive summary of the company's financial performance in the previous fiscal year; interim results announced in August focus on operating results for the six months prior to this fiscal year. These two results releases provide investors with an important basis for assessing the company's financial condition and future prospects.
U.S. Stock Earnings Reports expanded four times a year, divided into January through February (Q4, April through May (Q1), July (Q2), and September through November (Q3). The results of these releases reflect the financial performance of the company in the previous quarter.
How to ease the time for publishing company results? Futuity for the results!
This investment topic attracts the attention of investors due to the hot performance of the stock market every year. However, for the most part, the day of the announcement of the results has been difficult for the public. Futubull's“Results Calendar”The feature provides the latest HKMA earnings release schedule, detailed performance dates and price performance of a stock, and allows you to add core earnings dates directly to your mobile calendar to help you invest in your division's pre-performance investment strategy.

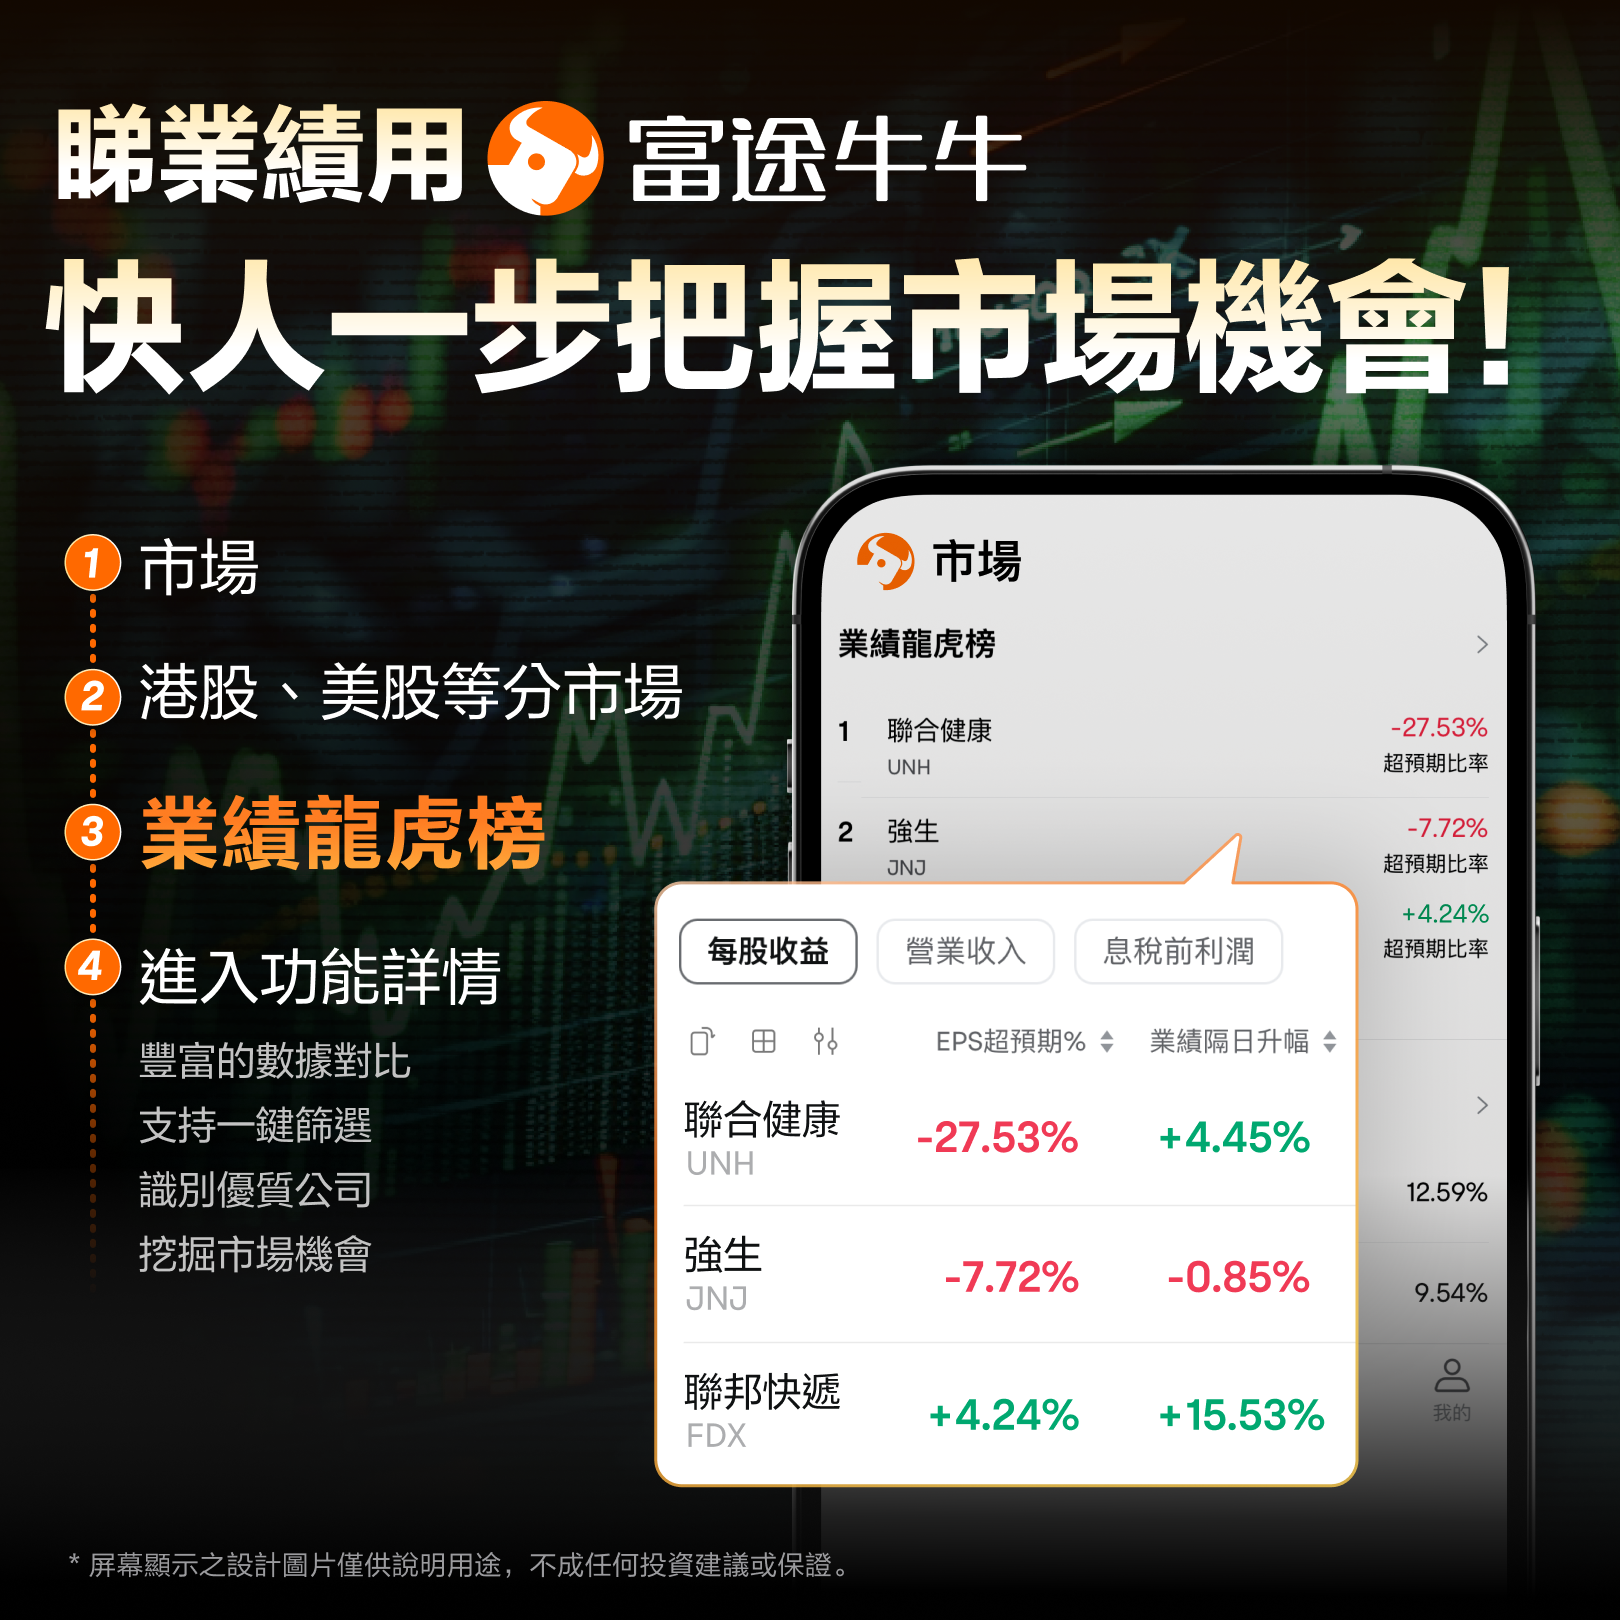
You can also use“Results Dragon Tiger List”Features that quickly filter out companies with results that exceed expectations and help you find potential stocks faster!
Top 3 Financial Statements
Financial Indicators such as revenue, net profit, cash flow, etc., are usually included in the performance report. These financial data help investors understand the financial performance and operating conditions of the company. There are three types of financial statements for the company's foundation, which are divided into asset and liability statement, loss statement and cash flow statement.
You can go through Futubull and see the lost financial situation of the company with one eye! Visible charts let you see how your company's finances are changing.
Open the Stock Quote page > Companies > Swipe down to Asset Form/Cash Flow Statement/Earnings Statement.
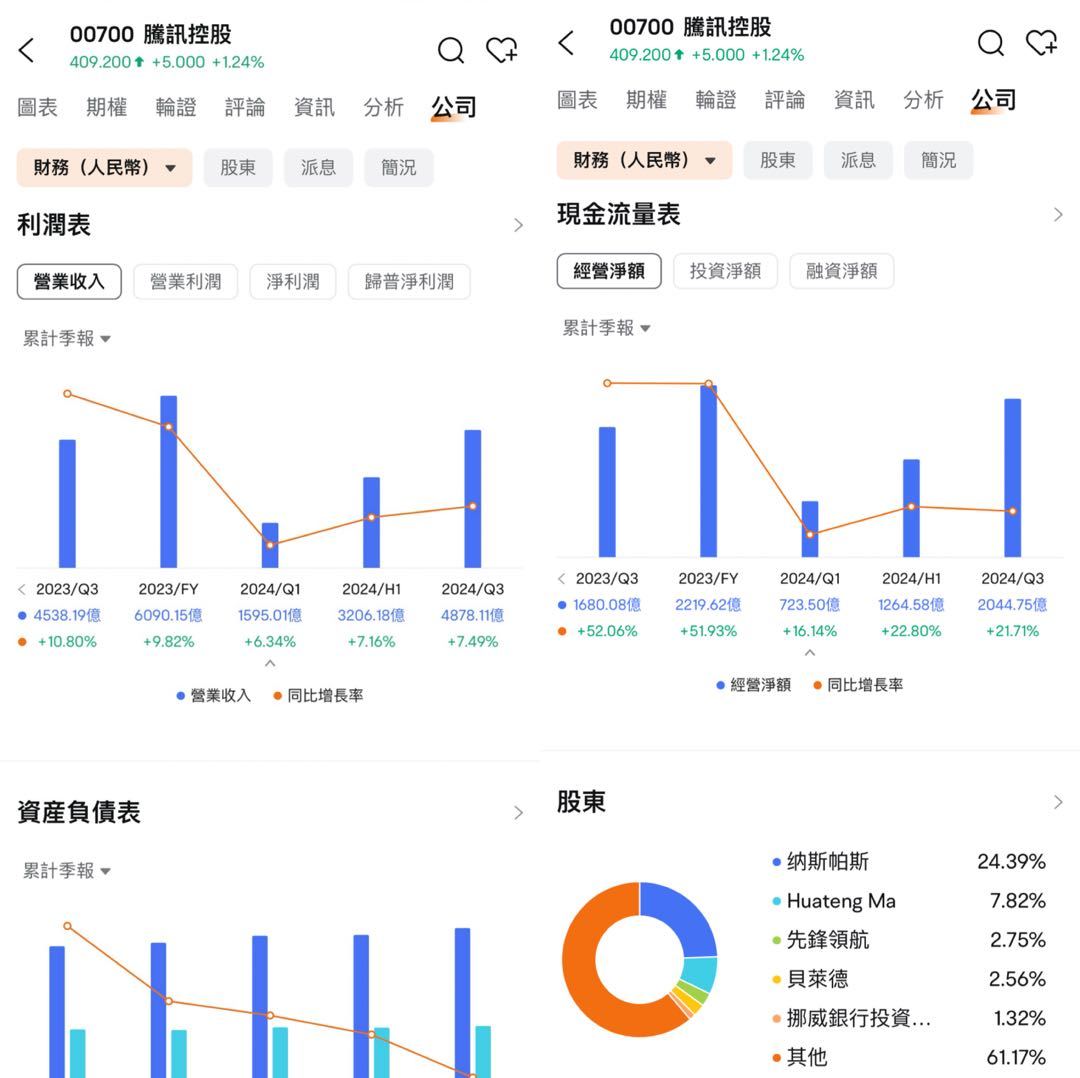
Balance Sheet
Shows the Total Assets, Liabilities and Shareholder Rights of the Company at a given time. Asset Forms reflect a company's financial condition and asset bond structure, helping investors understand the company's asset model, bond balance and net worth.
Income Statement
Displays the company's revenue, cost, and net profit for a given period. Loss performance reflects a company's performance and profitability, helping investors assess a company's operating performance and profitability.
Cash Flow Statement
Record the company's Cash Inflow and Outflow ratios over a specific period of time. Cash flow helps investors understand a company's cash compliance and cash operations. Cash flow is mainly divided into three categories: Cash flow from operations, cash flow from investment activities and cash flow from financial activities. These three major cash flows reflect the growth of corporate cash.
1. Operating Activities
Record the cash flow generated by a company during its operating business, including sales of commodities, purchase of raw materials, and payment of employee salaries. Operating Cash Flow is an Important Indicator in Financial Statements that reflects the cash income received by a company through its main business activities. Fair value operations cash flow shows the company's operating profit, and the value statement may contain operational issues.
2. Investing Activities
The cash flow generated by the company investment-related activities. This includes buying or selling Long-Term Assets, investing in Shares or Bonds of other enterprises, receiving shares paid from subsidiaries or joint ventures, and making cash payments for development or other long-term investments.
3. Financing Activities
Financial activities may include debt financing, equity financing, and Dividends. Issued Stocks or Loans to Banks will be counted as Aggregate Cash Inflows, or Shares Issued or Repurchased Shares will be counted as Aggregate Cash Outflow.
Futu Promotion ProgrammeProviding systematized teaching services, you are not a new investor or an experienced Trader. Equivalent courses will help you improve your skills and knowledge levels and achieve financial growth! You can join a private equity group, read the market in real time, and get senior strategists to solve investment questions 1-on-1!
Key Indicators in Performance Reports
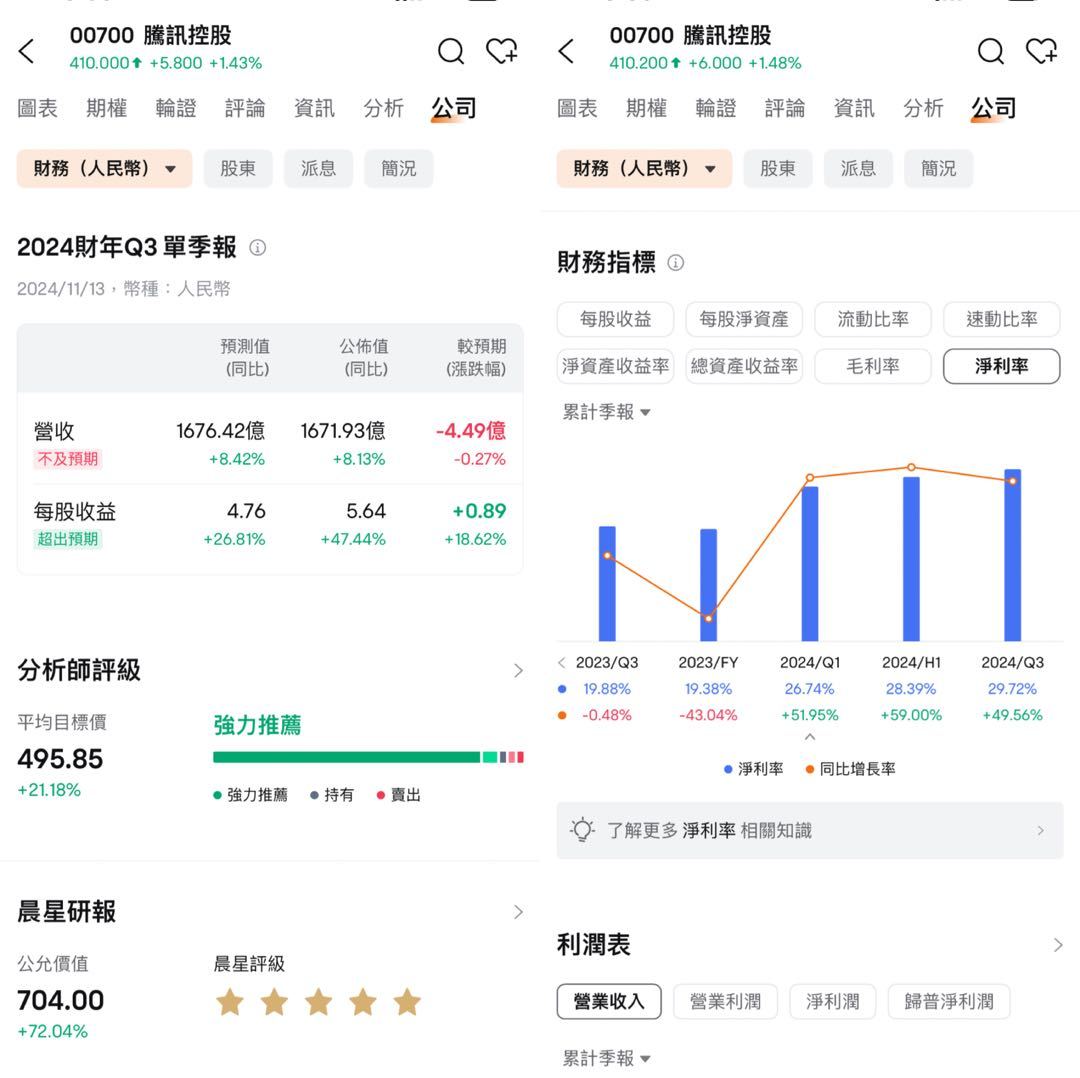
Do you need to look at a page of financial report data every time you want to read a company's performance report? Futubull shows 8 key Financial Indicators using a simple chart to help you see changes in outlook and growth. Open the Stock Quote page > Companies > Scroll down to Financial Indicators.
Futubull's focus is on a simple summary or forecast of the latest operating income and EPS status (outstanding/not and forecast), so that it is easy to find out ahead of time!
Revenue (Revenue)
Indicators reflect the company's market demand and sales performance through the total revenue generated by the affiliate business over a given period. Increased revenue may represent an expansion of a company's business, while a decrease in revenue may present a challenge to the business.
cost of goods sold (Operating Costs)
Cost of goods sold is the cost incurred by a company in the process of producing goods or providing services, including direct and intermediate costs (such as raw materials, employee wages, manufacturing costs, etc. These Indicators help to assess the operating efficiency and cost control capacity of an enterprise.
Net Profit
A company's ultimate profit after deducting all fees, taxes, and interest is a key Indicator of Corporate Profitability and reflects the overall financial health of an enterprise. The growth of net profit often reflects increased operational efficiency and effective cost control. Investors typically pay attention to net profit to gauge the value of a company's investment and future growth momentum.
gross margin (Gross Margin)
gross marginThe ratio of profit to revenue: (Revenue - cost of goods sold/Revenue × 100%, reflecting the profit ratio of the company in the production process. Higher gross margins usually mean that companies are able to produce lower-cost products, or have stronger market pricing power.
Net Profit Attributable to Shareholders
Discretion is the profit owed by the Shareholder after deducting all fees, taxes and fractional Shareholders' rights. These Indicators are directly related to Shareholders' feedback and reflect the Company's profit margin to shareholders.
Debt-to-Asset Ratio
Asset Liabilities RatioIt is the ratio of a company's Total Debt to Total Assets, which reflects the company's financial capacity and debt management capacity. A higher asset-to-debt ratio may indicate that the company is looking for external financing, higher risks, and may imply that the company is expanding and investing. A coordinated asset-to-debt ratio helps balance risk and returns, and ensures the financial stability of the enterprise.
Current Ratio
The ratio of floating assets to current liabilities is used to measure the short-term debt capacity of an enterprise. These Indicators show whether the company is able to repay short-term debt on time. A higher liquidity ratio is usually good for a company's mobility and can be adapted to evolving capital requirements.
Earnings Per Share
Stock Ratio is an indicator of the net profit of a company, reflecting the profitability of each stock. It is an important indicator of the value of a stock for investors.
Return on Equity (Return on Equity)
The ratio of net profit to shareholders' equity (Net Profit/Average Shareholder Equity ×100%), reflecting the company's ability to generate profits using Shareholders' capital, is one of the most important Indicators in reading the Earnings Reports.
Major companies' performance is a must see!
Securities Open Offer Futu Securities
New customers can open their doors in FutuWelcome Rewards of up to $1,000, and enjoy:
Hong Kong Stock Exchange Free, Free LV1 Live Quote
US stock odd lot 0Gold*,5x24 Hours Trading^,Free LV2 Live Quote
0 Commission for Crypto, HKD Direct Trade

Offer subject to terms and conditions.
*A U.S. stock odd lot refers to a trading unit of less than 1 share, trading less than one share of $0 cash and $0 exchange fee.
^US Stock Overnight Trading Risks and Risks. Before investing, please understand the specifics of US Stock Overnight Trading Services and understand other risks, and seek professional advice if necessary.
