Top US Stock Results Interpretations

Views 44162025.01.16

TSMC Results | Challenging Historical Highs, AI Competition's Biggest Gainer?

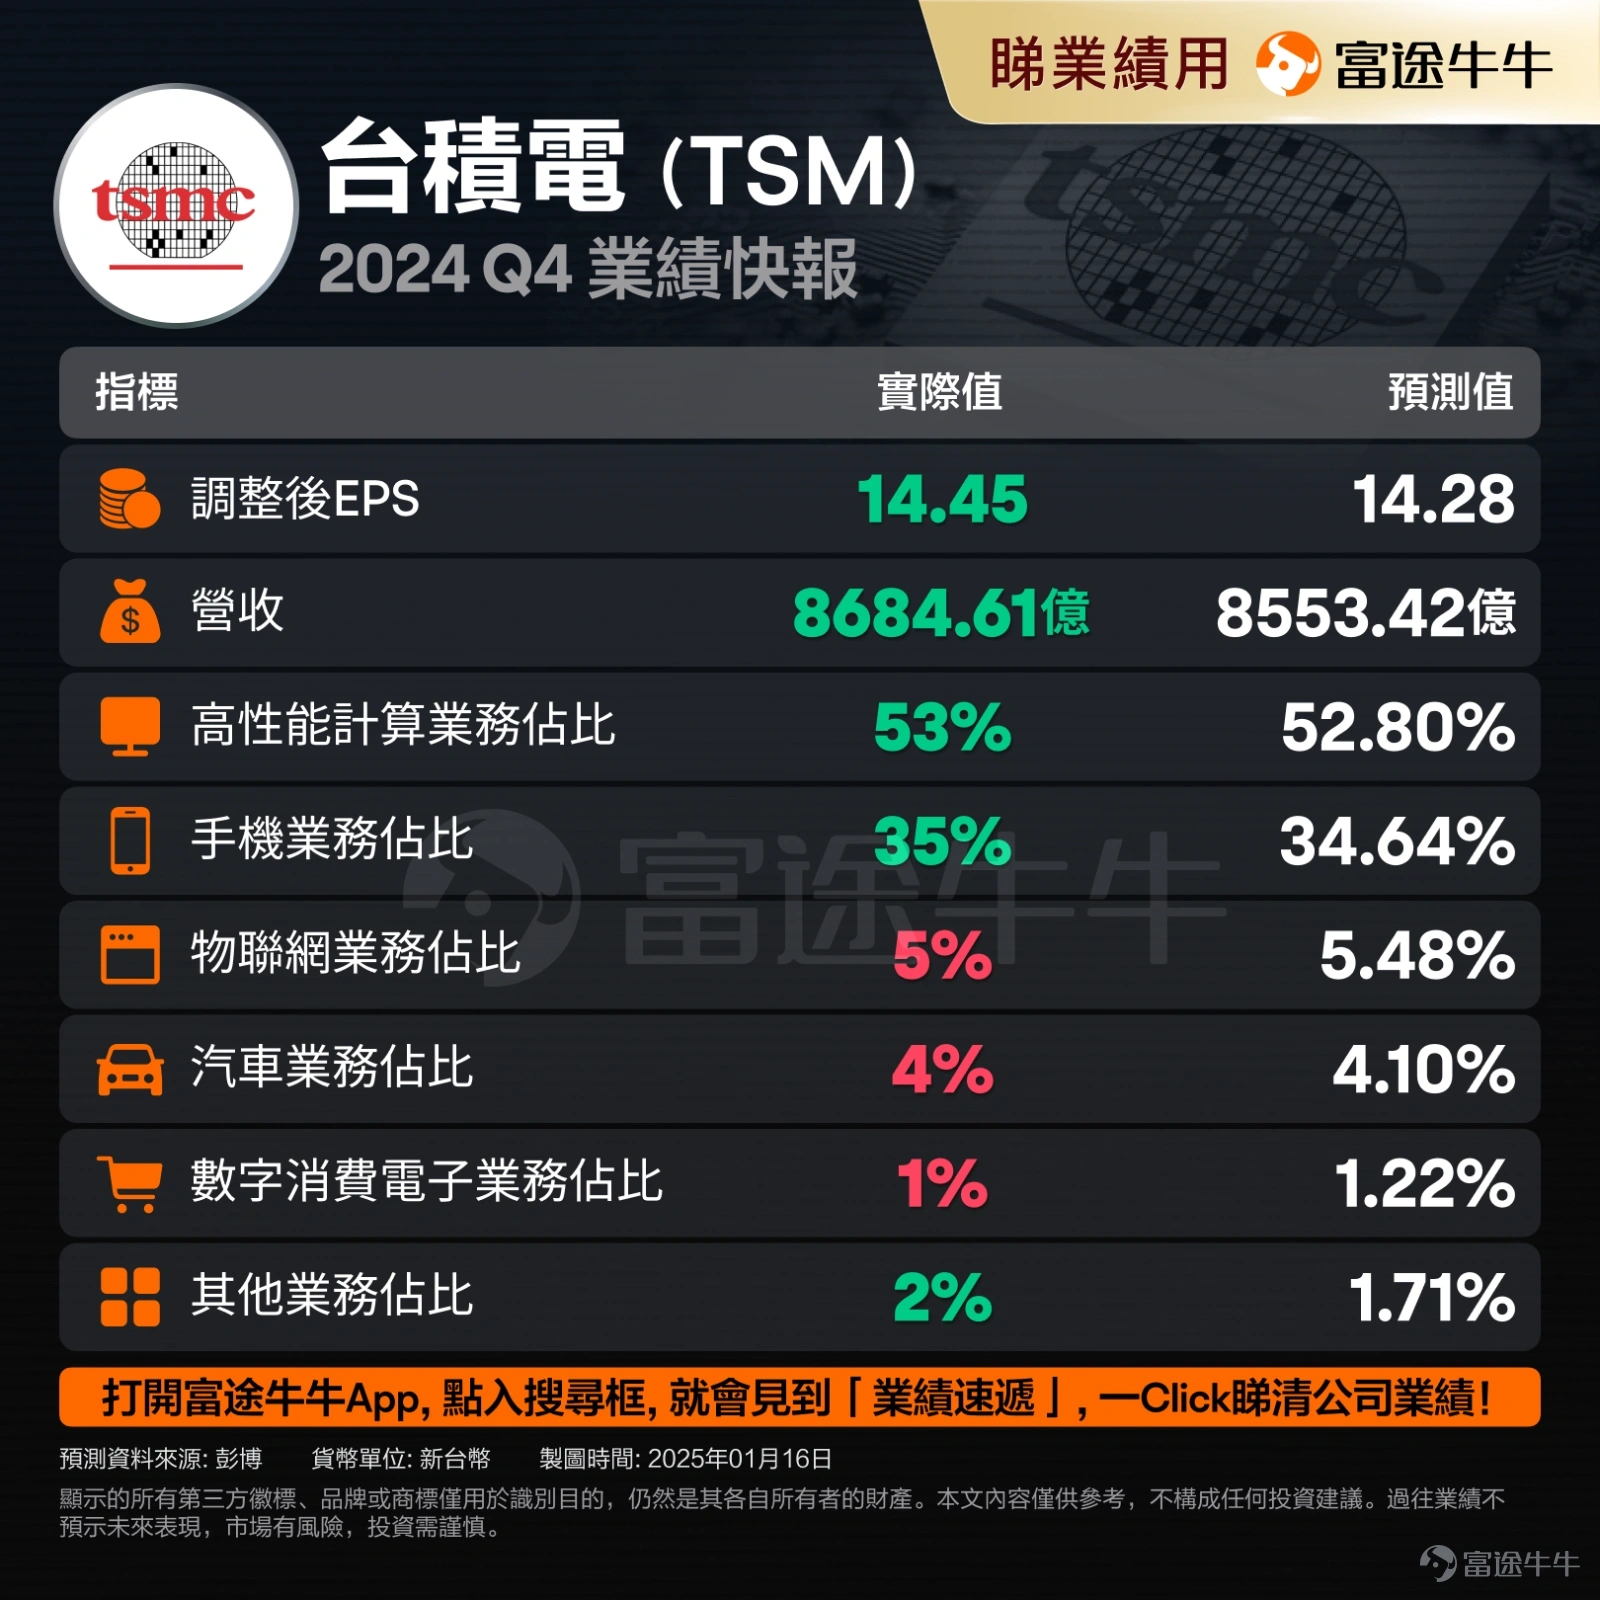
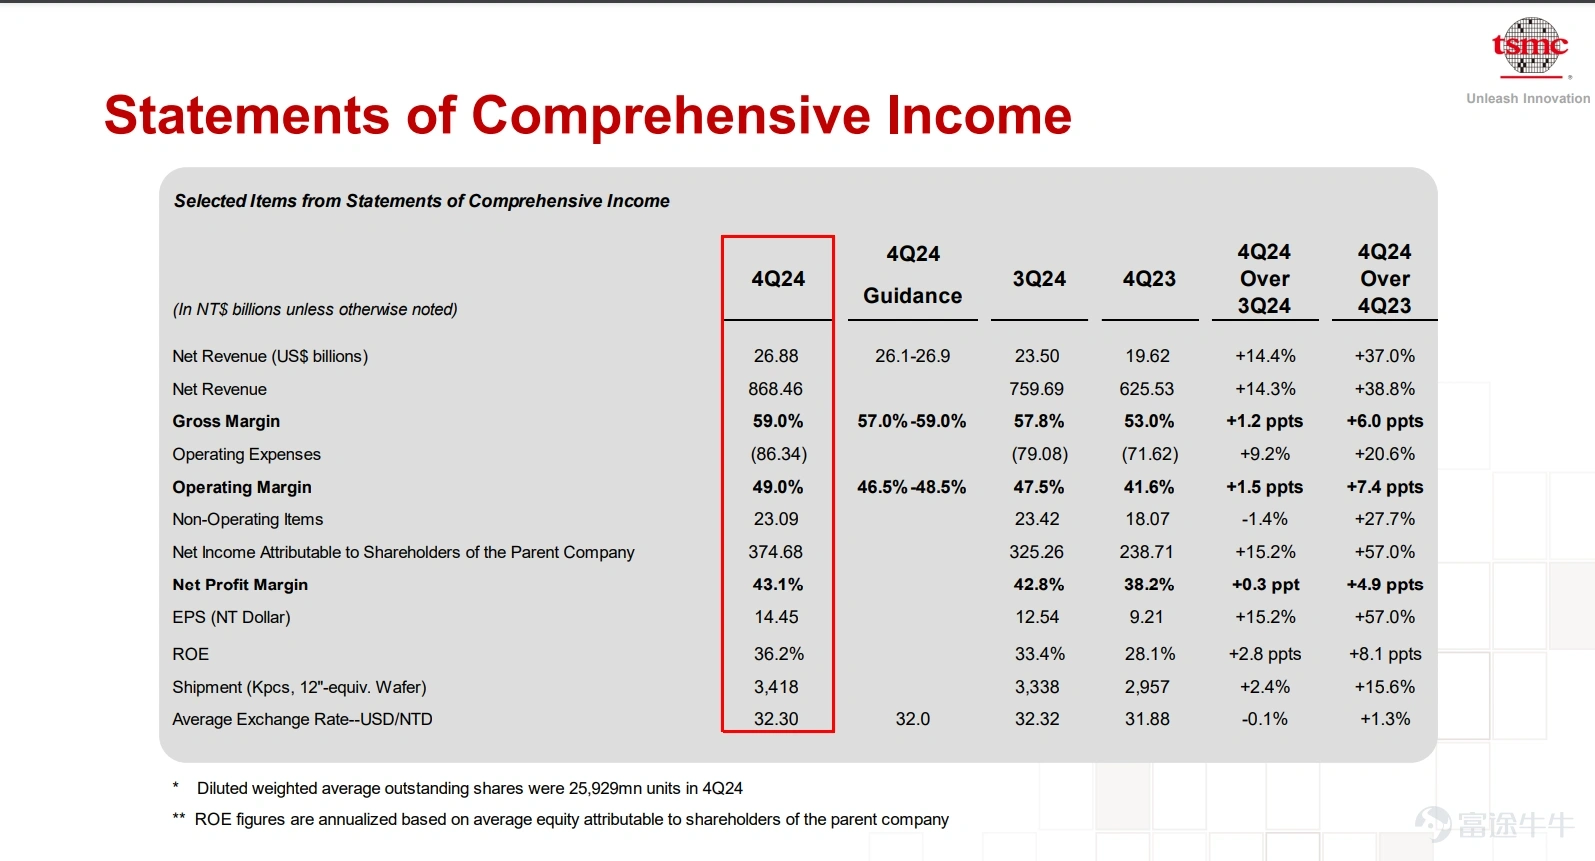
$Taiwan Semiconductor(TSM.US)$ Announcing Q4 results, the company's revenue continued to grow strongly, with Q4 2024 revenue of NT$868.461 billion, up 38.8% year-on-year; net profit of NT$374.68 billion, up 57% year-on-year; and diluted earnings per share of NT$14.45. Benefiting from the demand for computing power for high-end chips in the AI developing market, the company's 3nm shipments increased from 20% to 26% in Q3. This is the main reason that drove the company's gross margin to 59%, the upper end of the gross margin guidance of 57% to 59% for the fourth quarter of 2024. In addition, the company's ability to control costs was strong, and the operating margin increased to 49.0%, which was stronger than the previous quarter's guidance of 46.5% ~ 48.5%. Reflecting on TSMC's strong R&D capabilities, its ability to control costs should not be overlooked.

TSMC Performance Interpretation

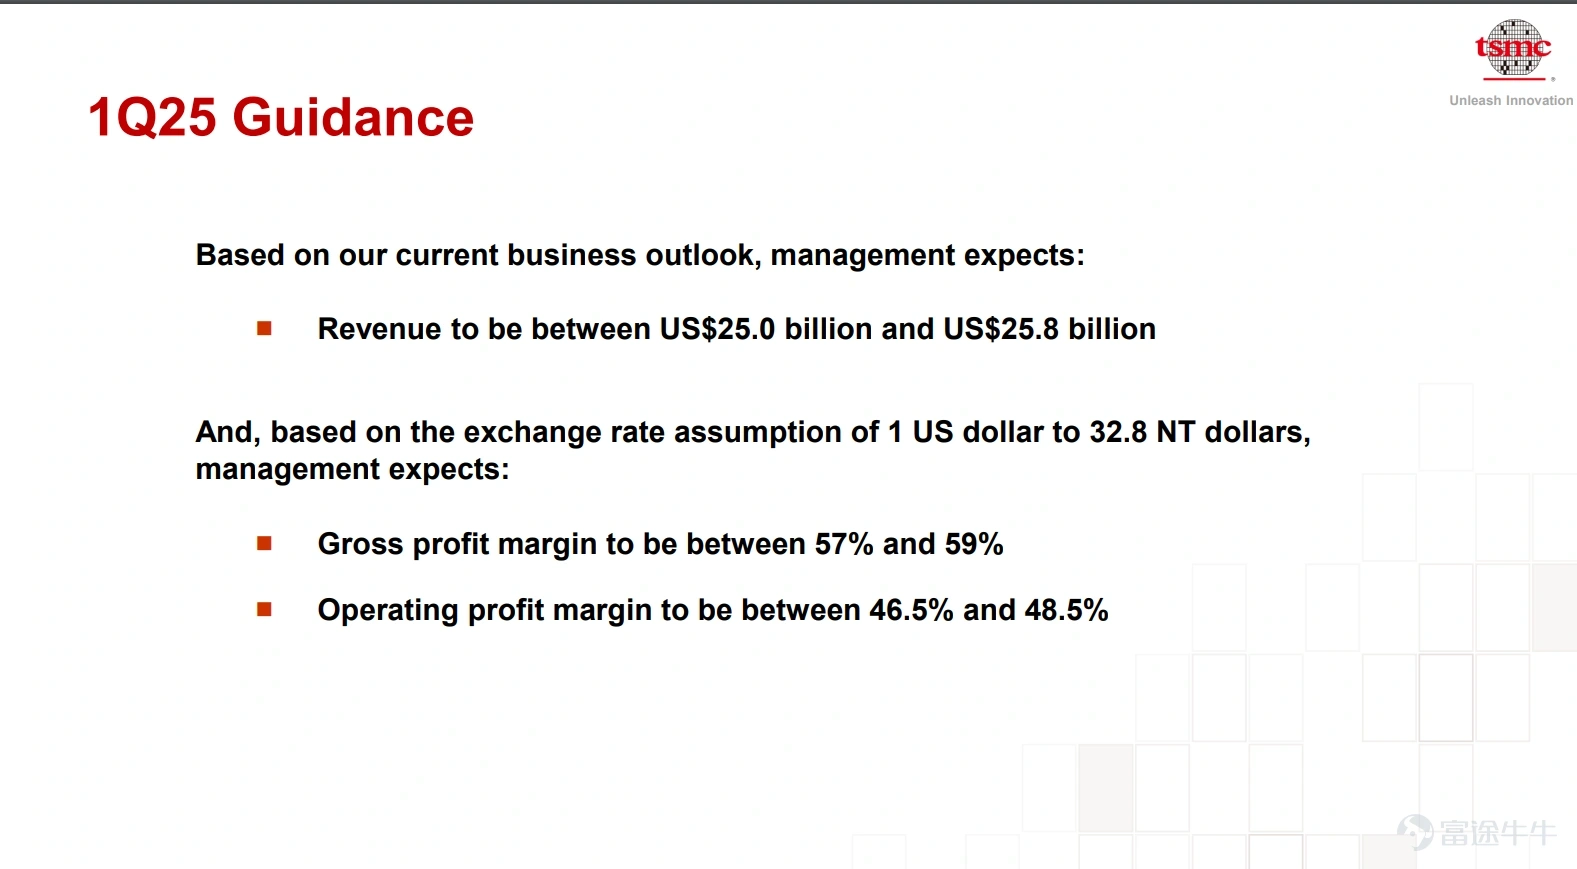
In this year's Q1 (1Q25) guidance, the company expects first quarter sales of $25 billion to $25.8 billion, higher than the market estimate of $24.43 billion. In USD terms, sales will grow by around 25% in 2025. The first quarter gross margin is expected to be 57% to 59%, which is 56.9% higher than the market forecast.

Operating Data

Considering that the market demand for high compute is still very large and there is no threat from competitors for the time being. And supported by AIPC and the new smartphone's AI capabilities, the benefits of momentum demand will be directly reflected in TSMC's performance.

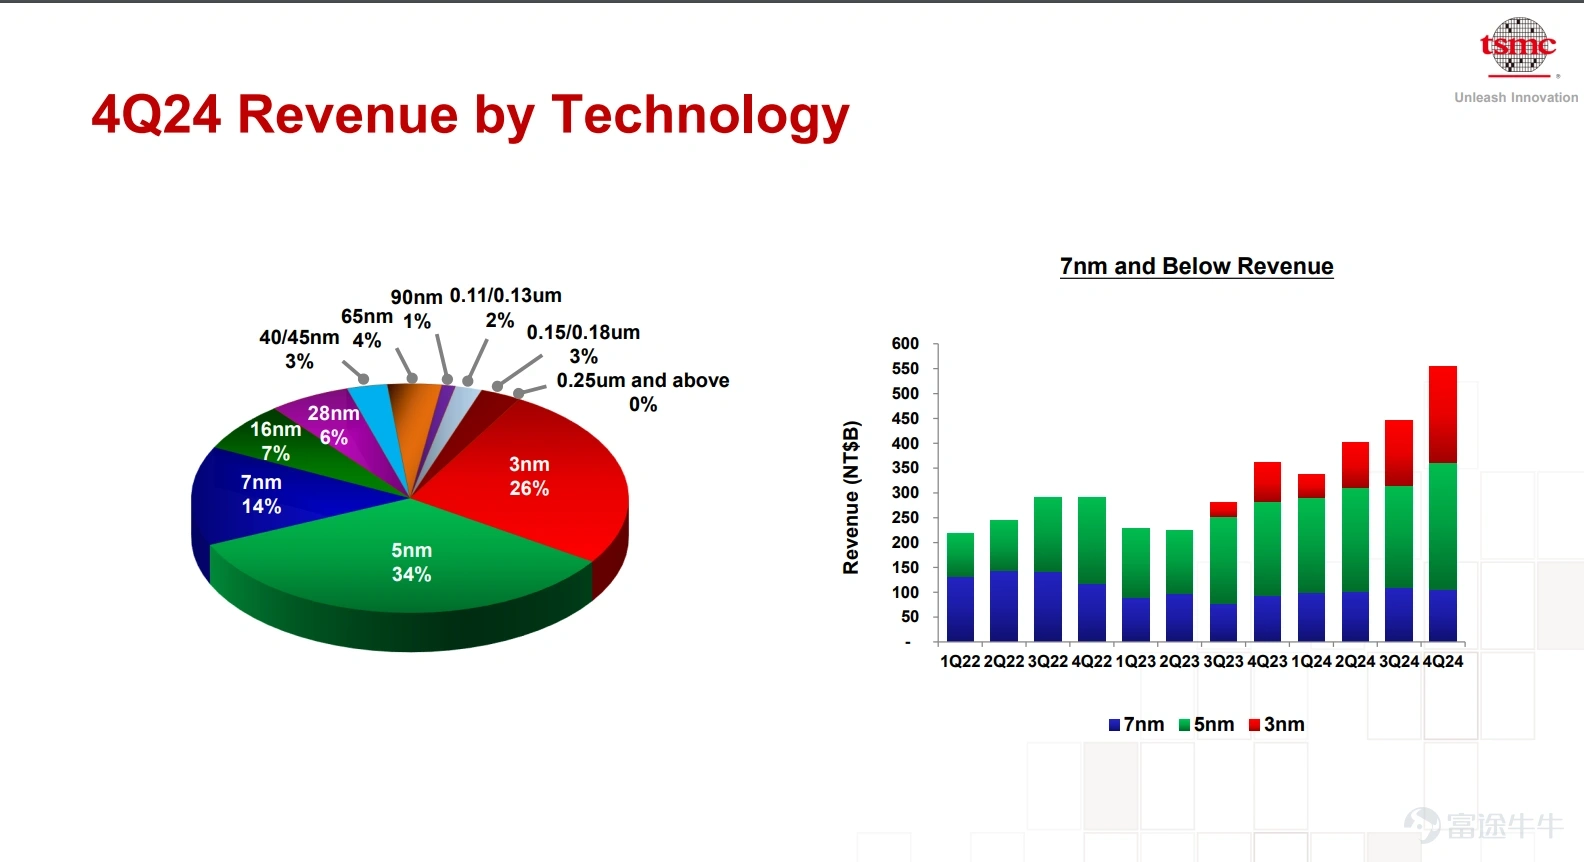
It is clear from TSMC's wafer revenue distribution above that the 3nm share is expanding, which is the main reason for TSMC's continued high gross margin and strong bargaining power.

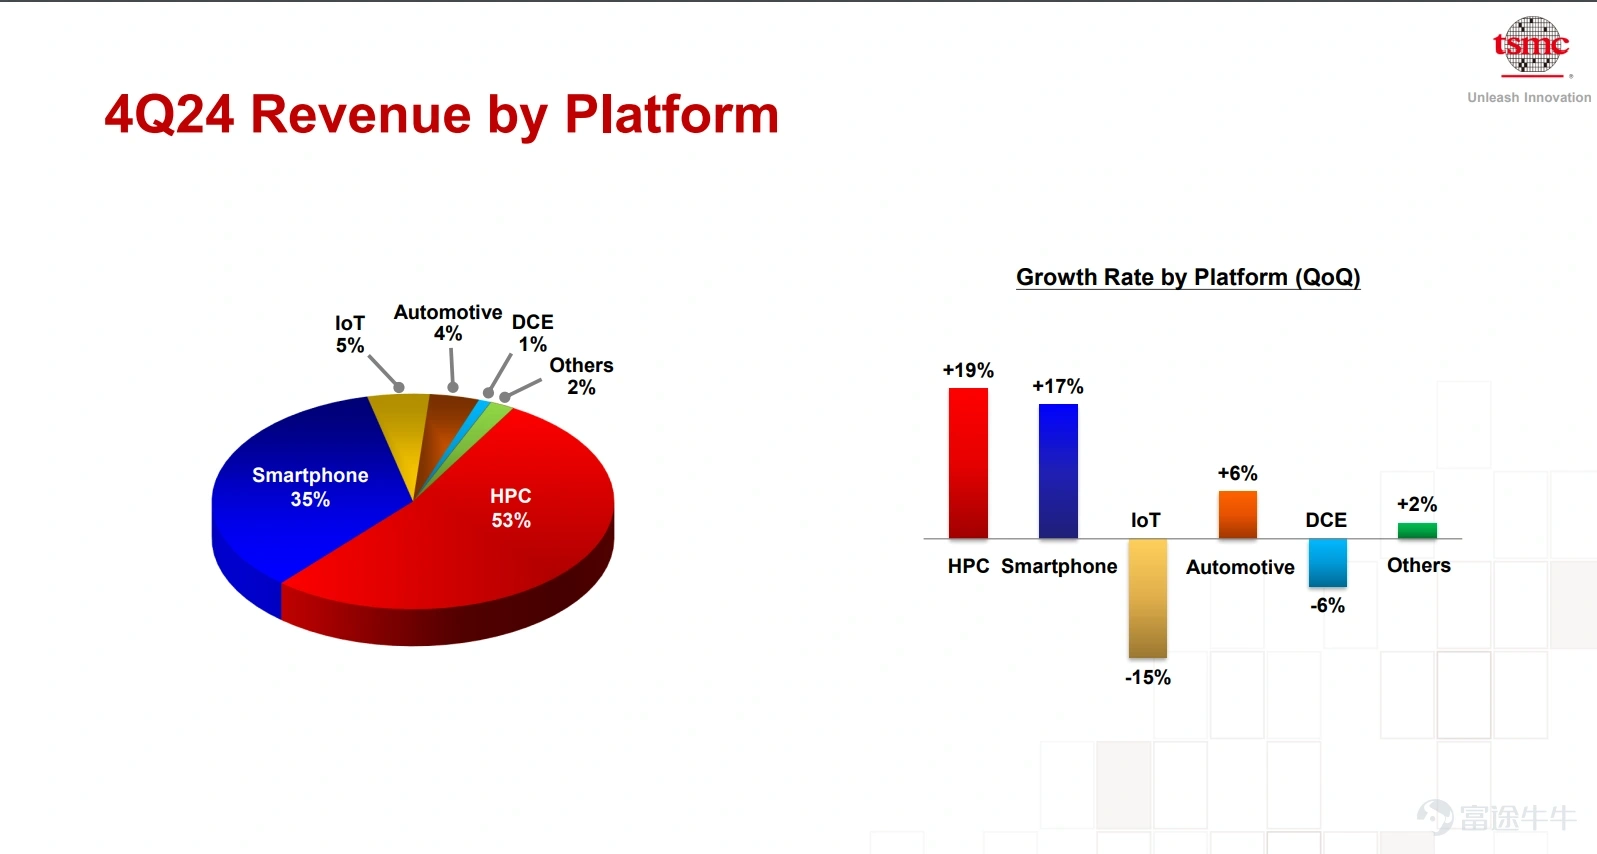
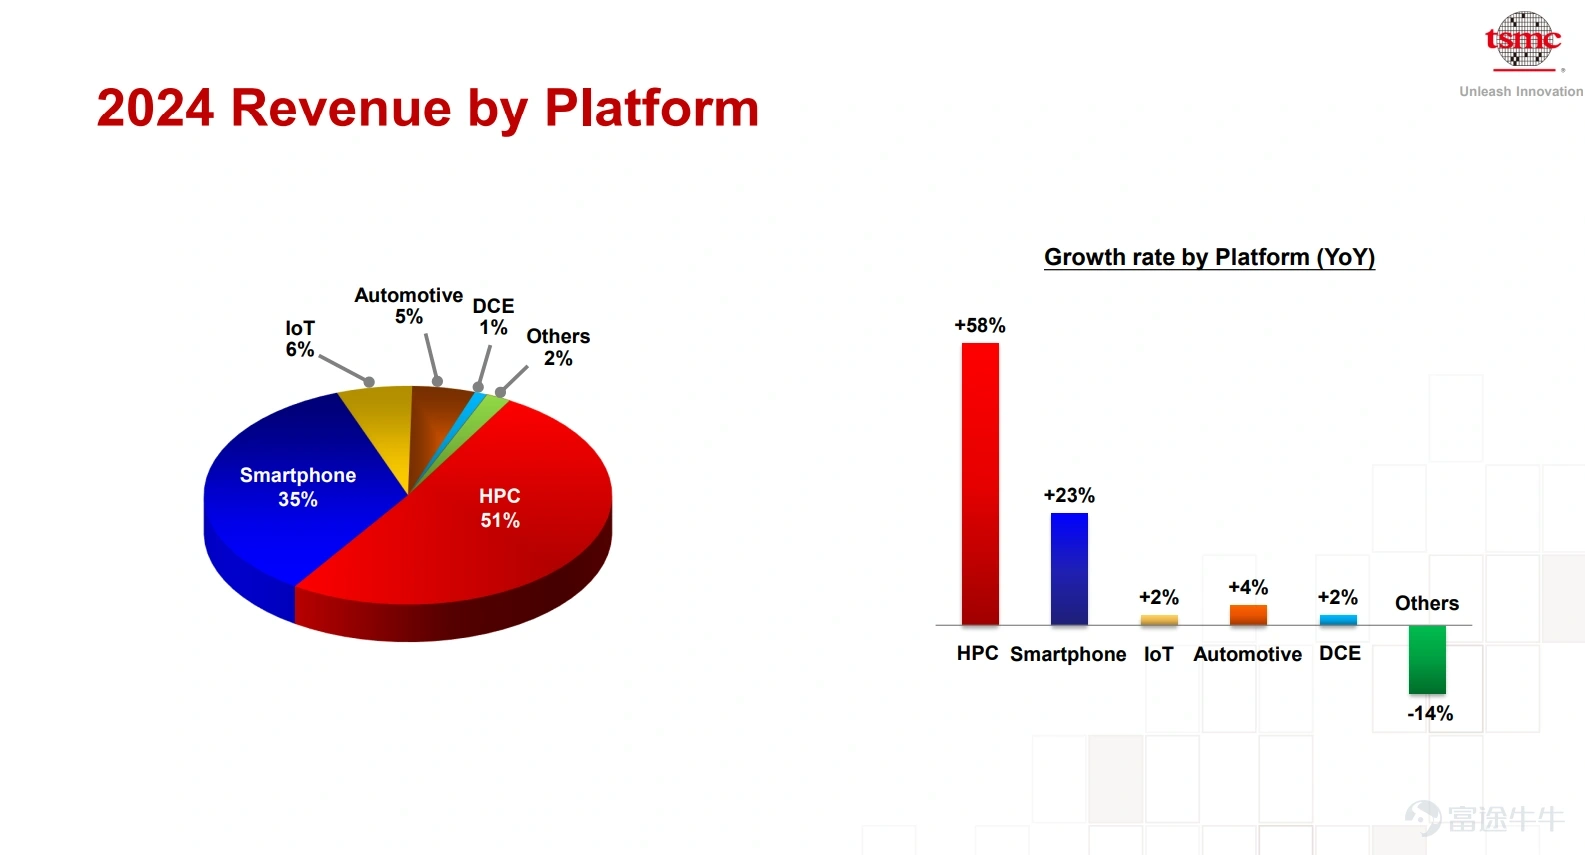
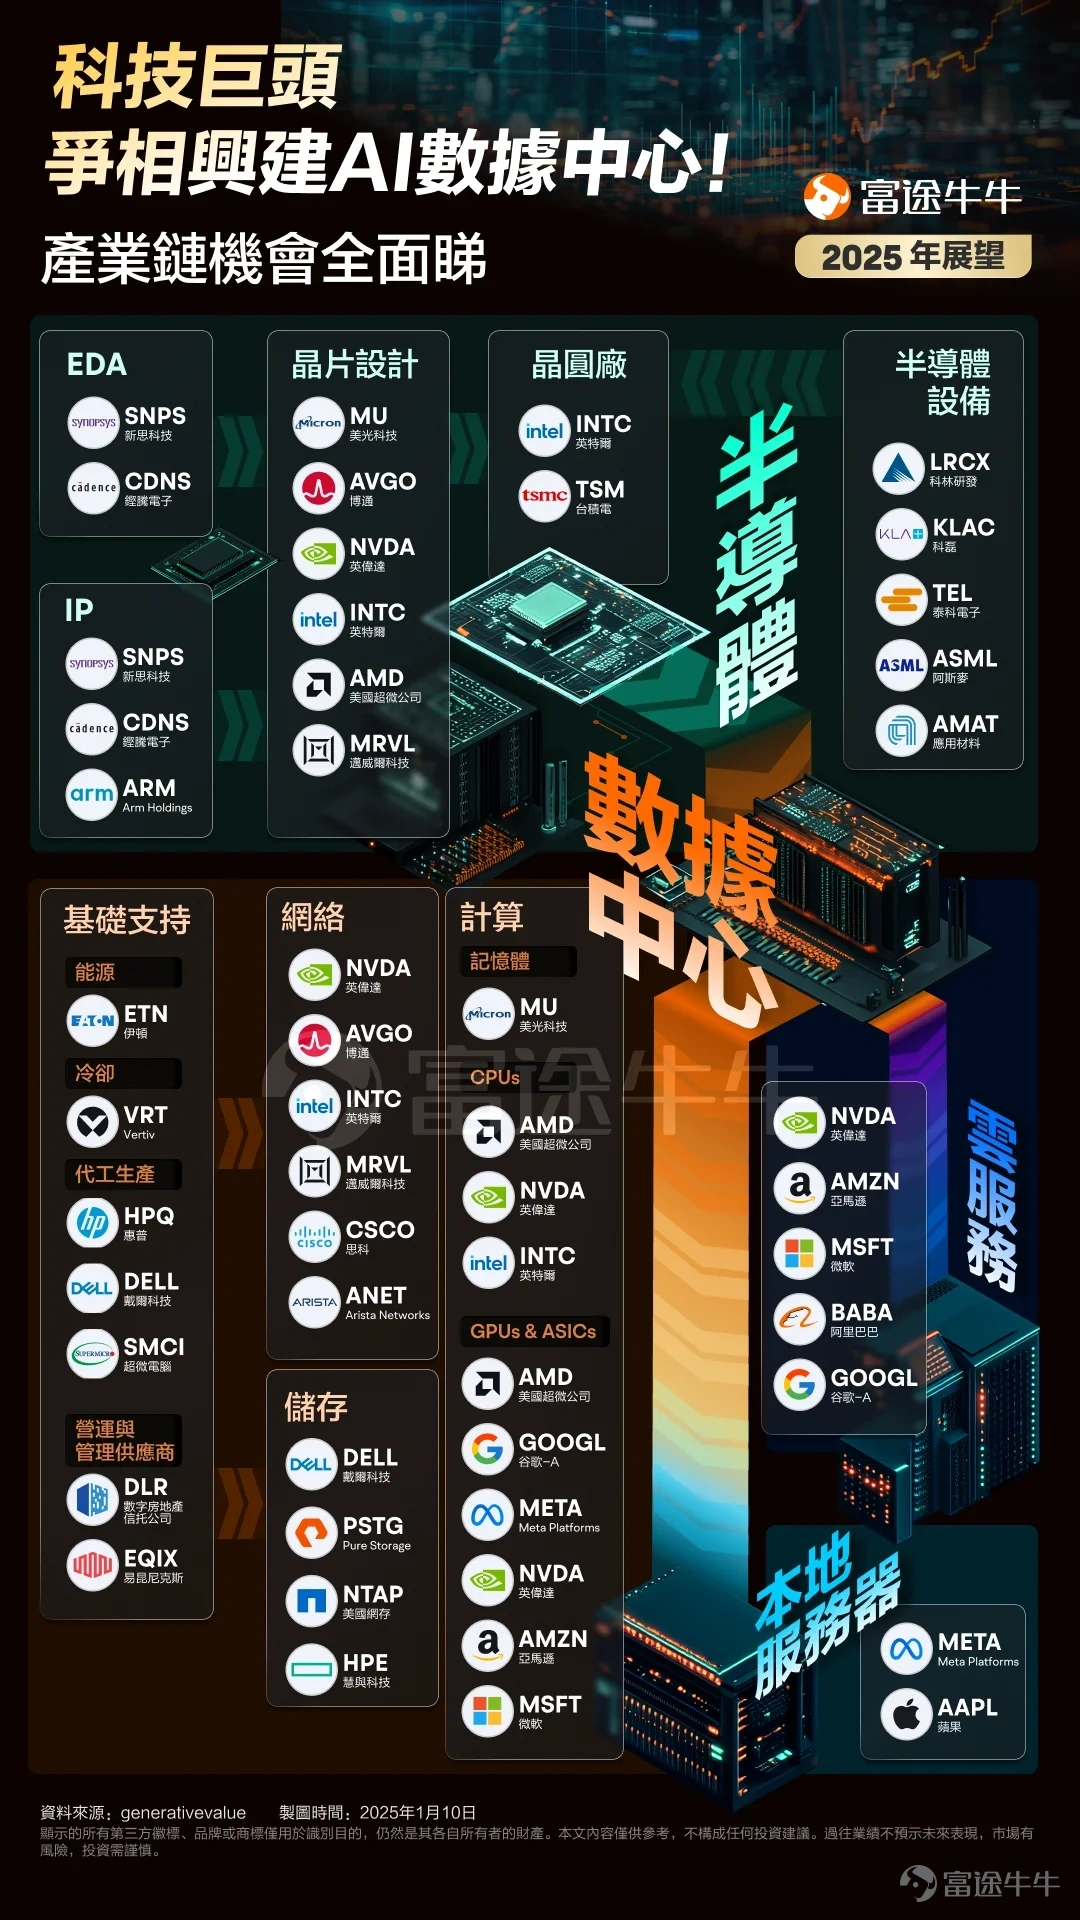
It is also clear from the chart above that high-performance computing (HPC) and smartphones remain the main drivers of growth on a quarterly and year-over-year basis. Given that there will still be many tech giants vying to build or upgrade AI data centers this year, TSMC is one of the biggest beneficiaries of the global AI development competition, there is no question.

Determination of TSMC Stock Price Results

We will use several angles to judge the stock price movement after the results:

1. Option Distribution

Supported by strong results, the share price is expected to break through the high of $222.2. First, you can take a look at the stock position announcement for the options, and first look at the 5 positions breakdown for the most recent “Expiration Date”:

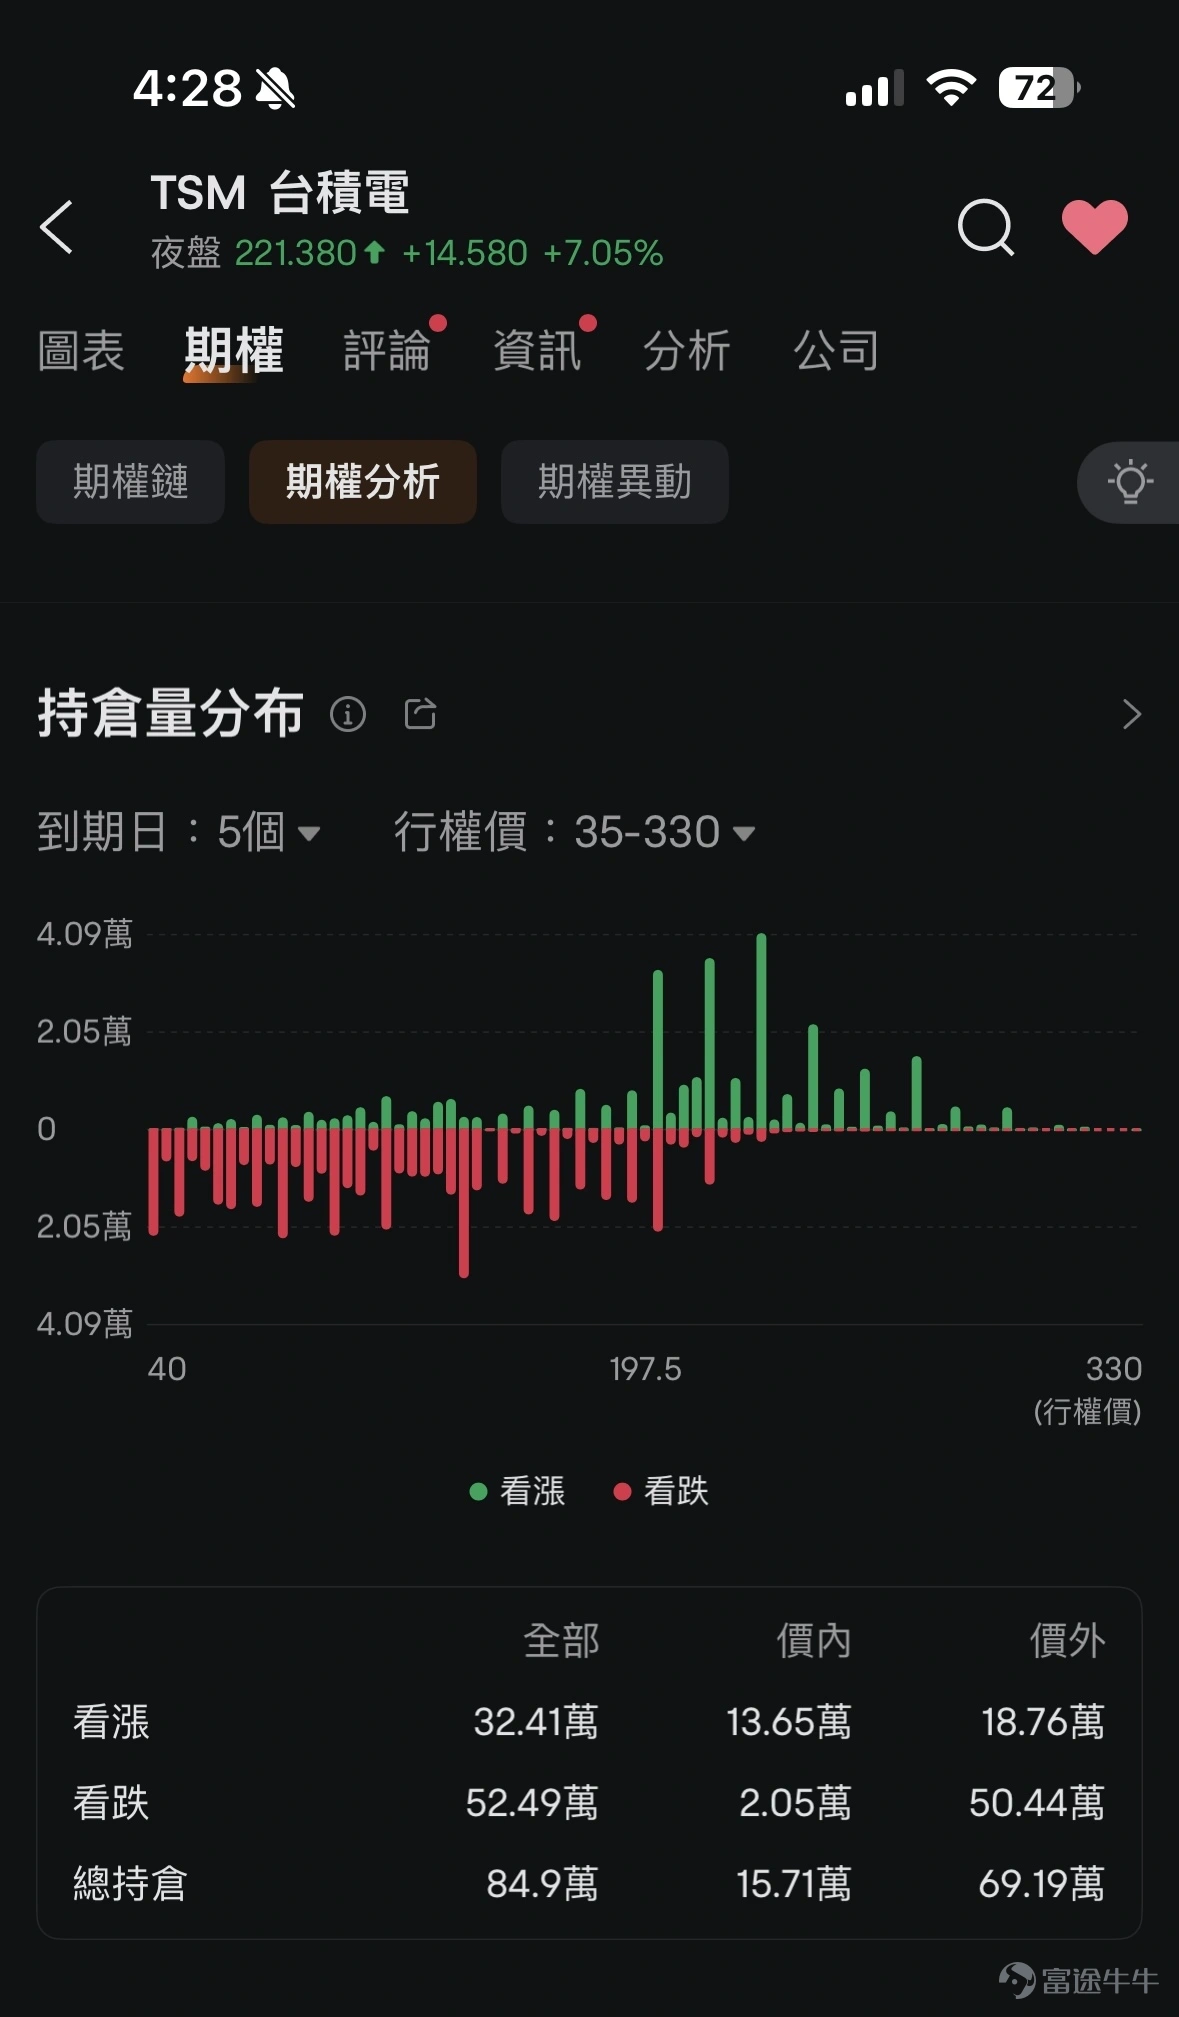
It can be viewed on Futubull phones, TSM->Options->Options Analysis->Hold Stock Breakdown. The most recent 5 call options were divided between $200, $210 and $220, with $220 being the most heavily traded at around 0.0409 million, which would amount to $0.9 billion at the current price of 100 shares and $220. You don't have to show a lot of clingy air warehouse behavior when you look at the Pythoplane heads. The $220 position will be a valuable reference.

2. Valuation Level

(Source: WIND)
(Source: WIND)

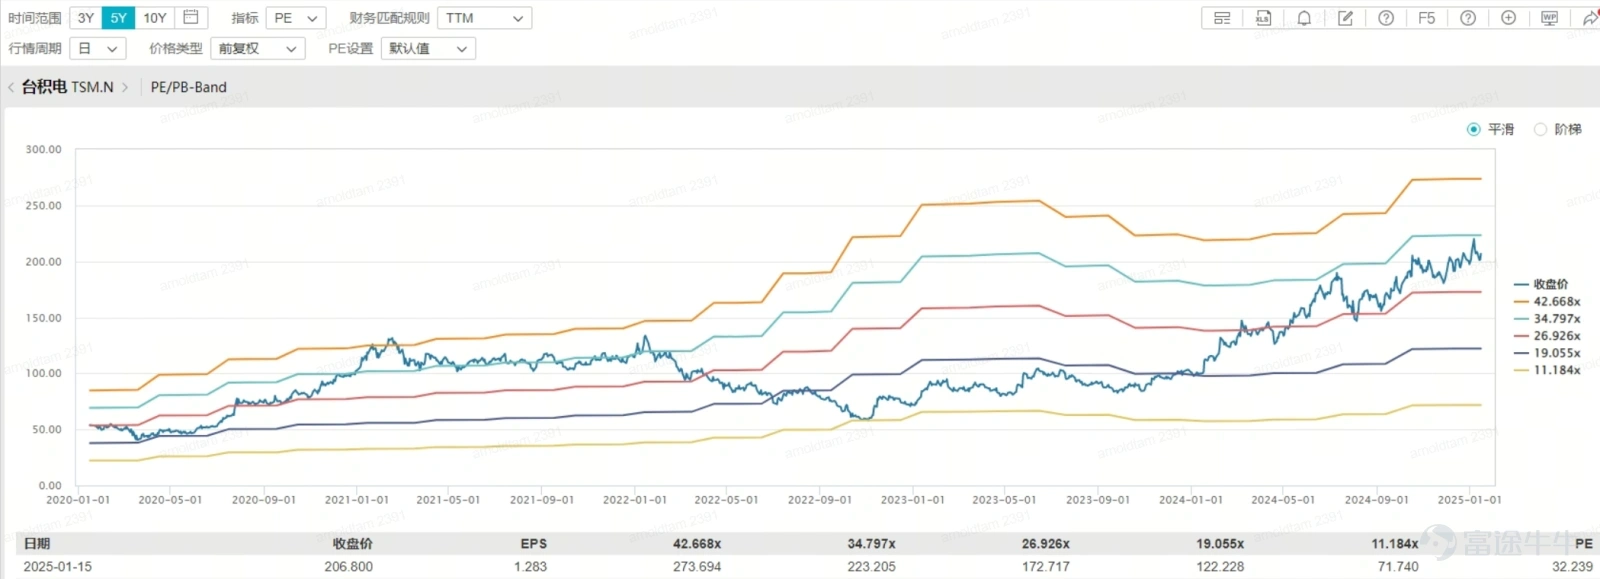
Reference the valuation levels of the past 5 years (the reason for 5 years is that AI is only a technology that has developed in recent years, it becomes too far inaccurate). The company's average market earnings over the past five years are approximately 26.9 times. With earnings per share ADR of $7.04 in 2024 results, the overnight listing price of about $220 at the time of writing is approximately 31.25 times market earnings. This figure is still below the estimate of about 35 times the 5-year average of about one standard deviation above. Given that TSMC's current profit growth space and development story remain very good, the authors consider the current valuation to be reasonable and attractive, even conditional to a level of 1 standard difference of around $246.

If the development of AI accelerates further this year, further straining the overall demand for momentum, the most bullish target price could reach two standard spreads of 42.6x market earnings, or close to $300.

3. TSMC Technology Analysis

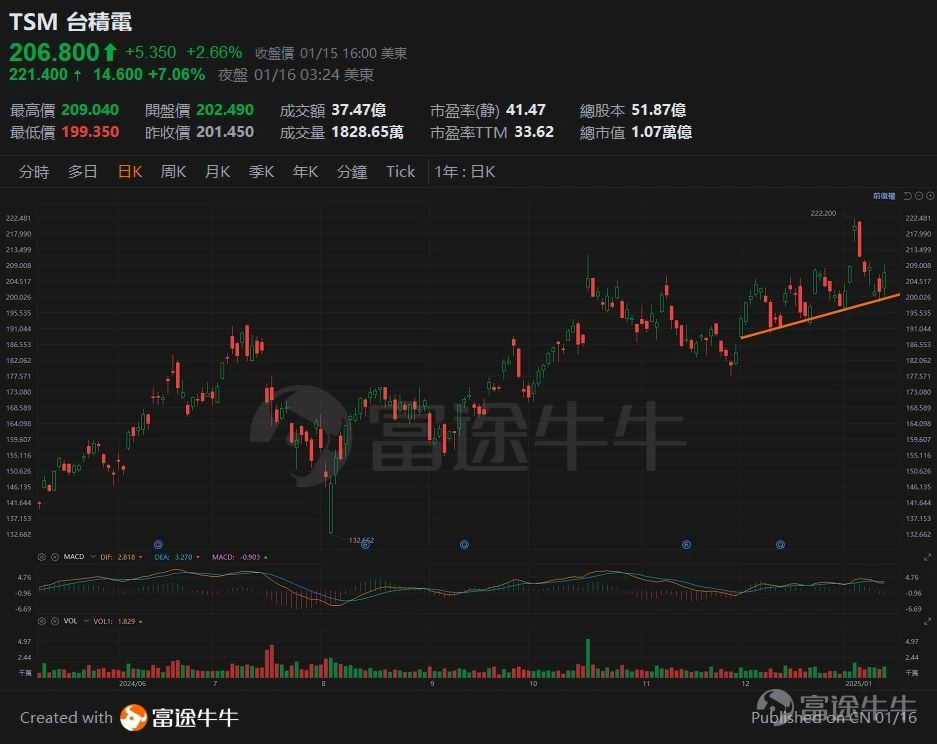
The share price has remained on a short-term upward trajectory since December, and the share price has performed better than the US stock market $S&P 500 Index(.SPX.US)$ und $Nasdaq Composite Index(.IXIC.US)$ 。 From the bullish track reference, it can be judged that $200 will be a key support position. The share price hit a high of $222.2 on January 6 this year, closed at $220.1 on the day, and then broke through on January 7. $220 will be a more critical resistance in the short term. If today's results break above this threshold, it will be favorable for the stock price to continue to hit new highs in the aftermarket. This view and options analysis are compatible.

In addition, the technical indicator MACD will form a “double bull” pattern if the position is able to signal a gold cross at a high level, which is a more favorable mid-term bullish signal.

  • Key Dividing Range (can be a support position or a resistance level): $220

  • KEY SUPPORT LEVEL: 200 YUAN

  • KEY RESISTANCE LEVEL: N.A. (BREAKING THE TOP WILL LEAVE NO CRAB SUPPLIES)

TSMC Investment Strategy Recommendations:

All in all, whether the share price can break above $220 in the short term will be a key factor. If a commodity investor is in possession, it is recommended to continue holding under the support of strong fundamentals. If you do not want to buy a commodity, consider a strategy of sell and sell options for the time being, earning the option money and deploying it to avoid the risk of a sharp rise in the stock price. If you're buying a major stock right now, it's best to adopt a mid-line investment mindset, or make a split bet with both hands ready.

  • Author Information

    Chief Analyst of Futu Securities Liang

    (Source: Company Reports)

    (The author is a licensee of the Securities and Exchange Commission and its affiliates do not have any financial interest in the Proposed Share Issuer)

One-stop trading with Futubull

Enjoy welcome rewards and lifetime 0 commission on HK stocks

Terms and conditions apply right-arrow

| GENERAL DISCLAIMER |

This report (the “Report”) is prepared by Futu Securities International (Hong Kong) Limited (“Futu Securities”). The person who retained this Report either via receiving and/or reading  (including any relevant attachment), shall agree to be bound by the terms and limitations set out below as has the right to retained this Report. Any failure to comply with these limitations may constitute a violation of the law.

This Report shall not be reproduced in whole or in part, distributed or published by you for any purpose. Futu Securities shall not be liable for any direct or consequential loss arising from any use of material contained in this Report.

The information contained in this Report has been obtained from public sources which Futu Securities has no reason to believe are unreliable and any analysis, forecasts, projections, expectations and opinions (collectively the “Research”) contained in this Report are based on such information and are expressions of belief only.

Futu Securities has not verified this information and no representation or warranty, express or implied, is made that such information or Research is accurate, complete or verified or should be relied upon as such. Any such information or Research contained in this Report is subject to change, and Futu Securities and/or its affiliated companies (collectively the “Futu Group”) shall not have any responsibility to maintain the information or Research made available or to supply any corrections, updates or releases in connection therewith. In no event will Futu Securities be liable for any special, indirect, incidental or consequential damages which may be incurred from the use of the information or Research made available, even if it has been advised of the possibility of such damages.

Any opinions, forecasts, assumptions, estimates, valuations and prices contained in this Report are as of the date indicated and are subject to change at any time without prior notice.

This Report is intended for general circulation only and does not take into account the specific investment objectives, financial situation or particular needs of any particular person. This Report should not and does not constitute an offer, solicitation, invitation, recommendation for buying or selling of investment products or as basis on making any investment decision, or constitute as professional advice from any member of Futu Group. The products mentioned in this Report may not be suitable for all investors and a person receiving or reading this Report should seek advice from a financial adviser regarding the suitability of such products, taking into account the specific investment objectives, financial situation or particular needs of that person, before making a commitment to invest in any of such products.

This Report should not be relied upon as authoritative without further being subject to the recipient’s own independent verification and exercise of judgment. The fact that this Report has been made available constitutes neither a recommendation to enter into a particular transaction nor a representation that any product described in this Report is suitable or appropriate for the recipient. Recipients should be aware that many of the products which may be described in this Report involve significant risks and may not be suitable for all investors, and that any decision to enter into transactions involving such products should not be made unless all such risks are understood and an independent determination has been made that such transactions would be appropriate. Any discussion of the risks contained herein with respect to any product should not be considered to be a disclosure of all risks or a complete discussion of such risks.

This report is provided by Futu Securities, which is regulated by the Securities and Futures Commission of Hong Kong (SFC) in Hong Kong. If you have any questions about the Futu Securities Research Report, please contact Futu Securities. The CE number of SFC held by the author has been disclosed next to the author's name on the front page of the Report.

Nothing in this Report shall be construed to be an offer or solicitation for the purchase or sale of a security. Any decision to purchase securities mentioned in this research should take into account existing public information, including any registered prospectus in respect of such security.

The Relevant Report does not have regard to any individual-specific investment objectives or financial situation. Individual investors should seek professional advice from an independent financial adviser, and refer to the relevant offering documents and/or other latest published information on the ETF including the risk factors regarding the suitability of specific investment products.

Information in the Relevant Report has been obtained or derived from sources generally available to the public and believed by the analyst(s) to be reliable.

All investments carry risks, and it is possible to lose the entire investment amount. Any past performances, projections, forecasts or simulation of results are not necessarily indicative of the future performance of any investments.

The ETF has not been and will not be authorised by the SFC under section 104 of the SFO. The Relevant Report does not constitute an advertisement, invitation or document which is or contains an invitation to the Hong Kong public to acquire an interest in or participate in a collective investment scheme under section 103 of the SFO.

| Certification |

Analyst(s) certified that (i) the views expressed in this Report accurately reflect his/her personal views on the listed corporation in this Report; and (ii) no part of his/her compensation was, is or will be, directly or indirectly, related to the specific recommendations or views expressed in this Report.

Analyst(s) certified that he/she and/or his/her associate did not deal in or trade the listed corporation or its relevant securities within the 30 days prior to and 3 business days after the issue of this Report.

| Disclosure of Interest |

Analyst Disclosure: Neither the analyst(s) preparing this Report nor his/her associate has any financial interest in or serves as an officer of the listed corporation covered in this Report.

Firm’s Disclosure: Futu Securities does not have any investment banking relationship with the listed corporation covered in this Report in the past 12 months nor any financial interest of 1% or more of the market capitalization in the listed corporation. In addition, no executive staff of Futu Securities serves as an officer of the listed corporation.

| Availability |

The information, tools and material presented herein are not directed, intended for distribution to or use by, any person or entity in any jurisdiction or country where such distribution, publication, availability or use would be contrary to the applicable law or regulation or which would subject Futu Securities to any registration or licensing or other requirement, or penalty for contravention of such requirements within such jurisdiction.

Information contained herein is based on sources that Futu Securities believed to be accurate. Futu Group and/or relevant personnel (i.e., employees of Futu Group) may have positions and transactions in relevant investment products. Futu Group and/or relevant personnel does not bear responsibility for any loss suffered by the investor from the use of or reliance on the information set out in this report.

For details of different product's risks, please visit the Risk Disclosures Statement on http://www.futuhk.com.

This Report is written in Chinese and English, and the two versions are equally valid. If there is any contradiction between the two versions, the English version shall prevail.


Recommended

    Market Insights
    HK Tech and Internet Stocks
    View More
    Nancy Pelosi Portfolio
    Will the 'tariff stick' strike again? Will the market remain 'reactive'?
    China and the United States have successively adjusted multiple tariff and non-tariff measures, beginning to implement the consensus outcome Show More