How to play virtual currencies?
What is the price trend of Bitcoin? How should one invest in Bitcoin in 2026?
Latest BTC Price Movement
BTC/USD Instant Price Movement
Bitcoin Price Trend Analysis (May 2026)
U.S. stocks have been on a strong rally for months,$S&P 500 Index(.SPX.US)$After seven consecutive weeks of gains,$Nasdaq Composite Index(.IXIC.US)$The Nasdaq also remained strong, despite a single-day pullback in U.S. stocks last Friday.$Bitcoin (BTC.CC)$At around $82,000 over the weekend, a wave of short liquidations was triggered, causing BTC to once again fall below the critical $80,000 level.
Why hasn't Bitcoin (BTC) risen in tandem with U.S. stocks this month? In my view, it's mainly constrained by the following five factors:
1. South Korea's stock market is attracting strong capital inflows as funds shift from the crypto market.
South Korea's KOSPI index has repeatedly hit new highs, with its gains doubling over the past year, and AI-related stocks such as Samsung Electronics and SK Hynix have delivered stellar performance. Local retail investors are experiencing intense fear of missing out (FOMO); reportedly, new securities accounts opened by those under 18 surged nearly tenfold in the first quarter of this year. Meanwhile, a substantial amount of capital has flowed out of the cryptocurrency market into traditional stock markets, leaving Bitcoin largely overlooked.
2. Liquidity Concentrated in U.S. AI Star Stocks
Market attention is focused on U.S. equities in AI-related sectors (such as$NVIDIA(NVDA.US)$ $SanDisk(SNDK.US)$ $Micron Technology(MU.US)$ $Intel(INTC.US)$ $Advanced Micro Devices(AMD.US)$ $Lumentum(LITE.US)$etc.), coupled with the boost to tech stocks from U.S. visits to China, capital continued to flow into traditional stock markets, while the crypto market lacked new inflows, putting downward pressure on Bitcoin's price.
3. Bitcoin has accumulated a large number of leveraged contracts within a trading range, with long-short battles suppressing the price.
Bitcoin has accumulated a large number of leveraged contracts in the $78,000 to $80,000 range, with bulls and bears locked in a fierce battle. Although it briefly broke above $82,000 over the weekend, triggering short-covering rallies, it subsequently fell back below $80,000, indicating heavy resistance at higher levels and making it difficult for Bitcoin to follow U.S. stocks higher in the short term.
4. U.S. Treasury yields rise; market expectations point to rate hikes rather than cuts.
The yield on the U.S. 10-year Treasury note rose above 4.5%, at one point approaching the historical warning threshold of 4.75%. Coupled with high oil prices and strong CPI and PPI data, the market generally expects that, over the next six months, interest rates will not be cut—and there is even a possibility of rate hikes. This puts pressure on all overvalued assets, including Bitcoin, as investors tend to seek safe havens rather than pour into cryptocurrencies.
5. U.S. stocks harbor adjustment risks; investors remain on the sidelines.
Although U.S. stocks have repeatedly hit new highs, Wall Street has generally been "raising price targets while warning of downside risks." With investors growing cautious at elevated U.S. stock levels, they may be hesitant to pour heavily into the Bitcoin market, which is inherently more volatile, causing BTC to fail to keep pace with the gains.
Therefore, the three major factors—recent capital flowing into South Korean stocks and U.S. AI stocks, Bitcoin's own leveraged structure exerting downward pressure, and bond yields and rate-hike expectations weighing on overvalued assets—have caused BTC to "decouple" and decline even as U.S. stocks hit new highs.
However, in other words, downward pressure on U.S. stocks is mounting, prompting investors to seek new safe havens. Meanwhile, amid expectations of geopolitical tensions, soaring oil prices, and fiat currency depreciation, Bitcoin's dual attributes as a safe-haven asset and "digital gold" have been rekindled. At the same time, following the preliminary passage last week of the Clarity Act, which will definitively clarify the distinctions between cryptocurrencies and securities, more long-term capital is expected to flow into the market.
With U.S. Treasury yields currently rising, the risk of a correction in U.S. stocks from their lofty levels cannot be ignored. Meanwhile, after a prolonged period of suppression, Bitcoin has begun to show resilience around the $75,000 mark. We believe Bitcoin represents the future trend that will disrupt traditional finance—stablecoins, RWA, and national-level consensus—and investors may consider gradually accumulating through dollar-cost averaging (DCA). Remember: building life-changing wealth never comes from chasing highs during market exuberance, but from consistently sowing seeds when few are paying attention. BTC, which has not followed U.S. stocks higher despite their record highs, may well be quietly waiting for the start of the next bountiful bull market.
Bitcoin Price Trend Analysis (October 2025)
On October 11, the cryptocurrency market experienced the largest liquidation event in its history—1.6 million traders were liquidated, with daily leveraged liquidations exceeding $19 billion. On that day, numerous altcoins plummeted sharply, while only the major cryptocurrencies—$Bitcoin (BTC.CC)$Instead, it has demonstrated remarkable price resilience—holding steady above the 100,000-yuan mark, with intraday volatility limited to just 15%. Moreover, compared with the crypto market's "312" crash of 2020, the "519" event of 2021, and the FTX debacle of 2022, this latest plunge is relatively mild.
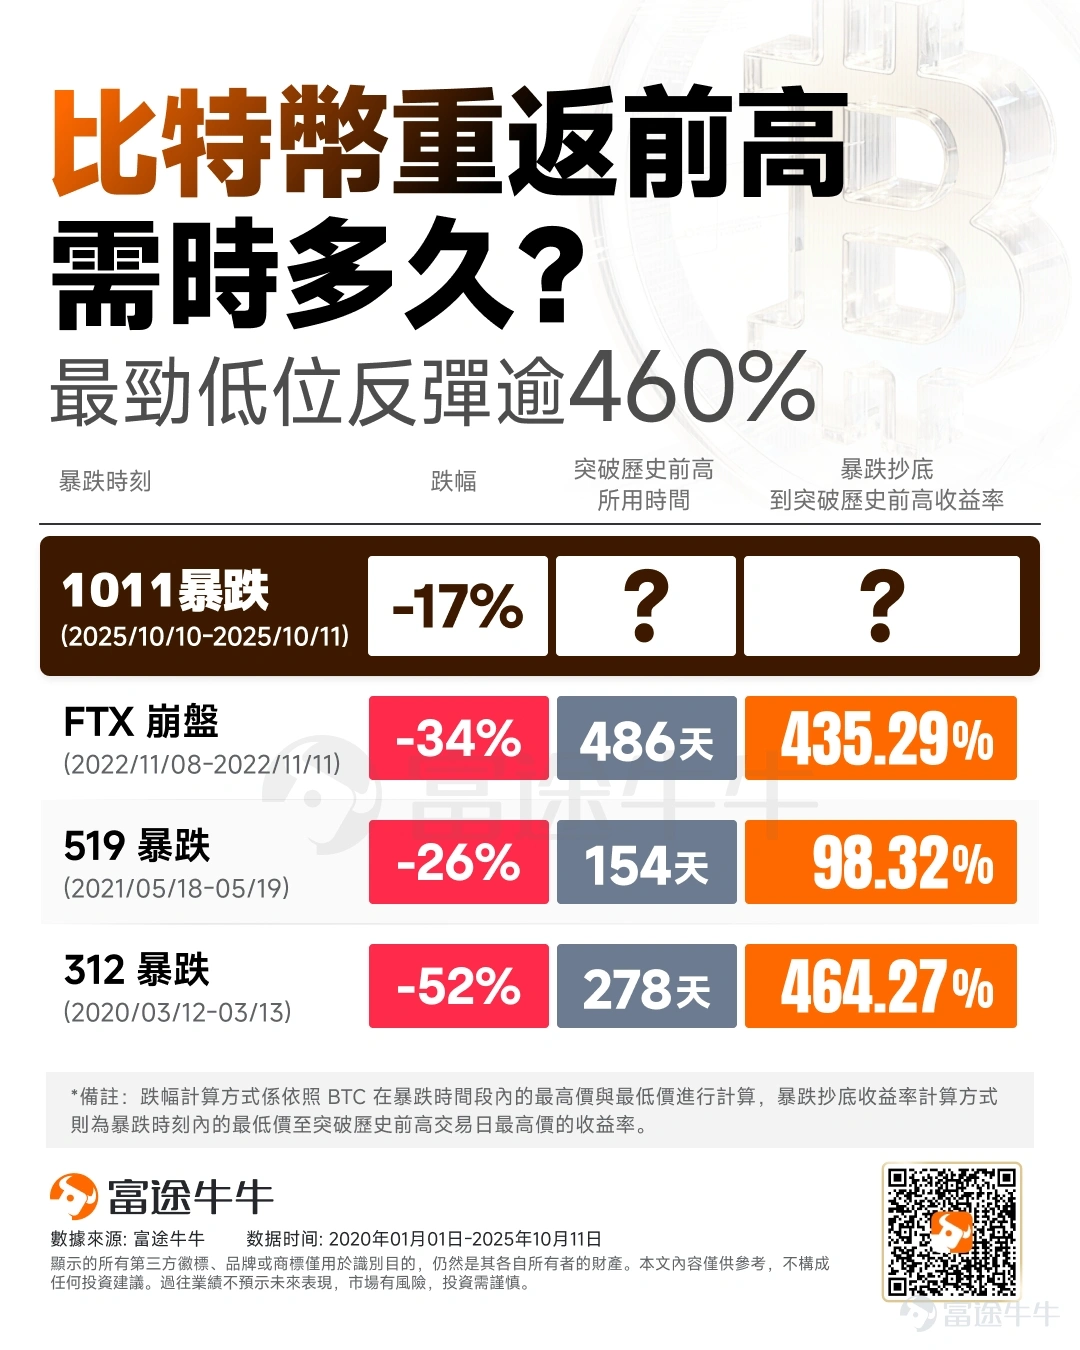
There's still a chance for "Uptober" in October.
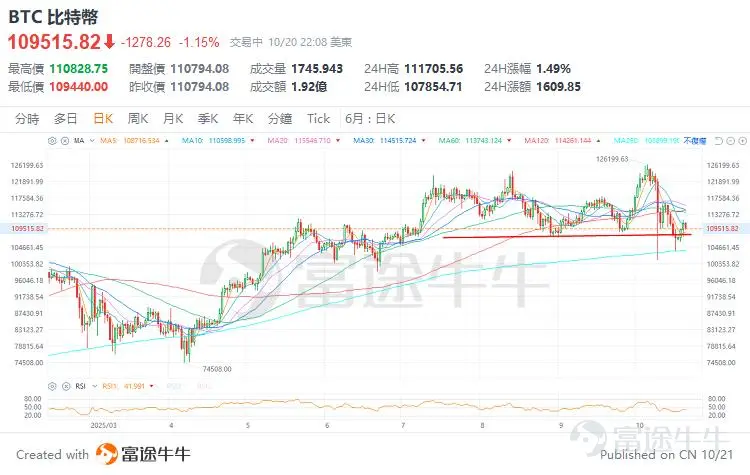
In fact, during a bull market, corrections of around 20% are still within a reasonable range. There is reason to believe that as long as Bitcoin holds steady above the $108,000 level (see the chart below), it still has a chance to challenge new all-time highs in October or later this year.
Over the past 12 years, Bitcoin has seen a strong upward trend in October as often as 80% of the time. And in years when September ended on a positive note, October almost always followed with gains (see the chart below), which is why the crypto community refers to it as "Uptober." It remains to be seen whether history will repeat itself this year, but market sentiment still anticipates another bullish October for Bitcoin.
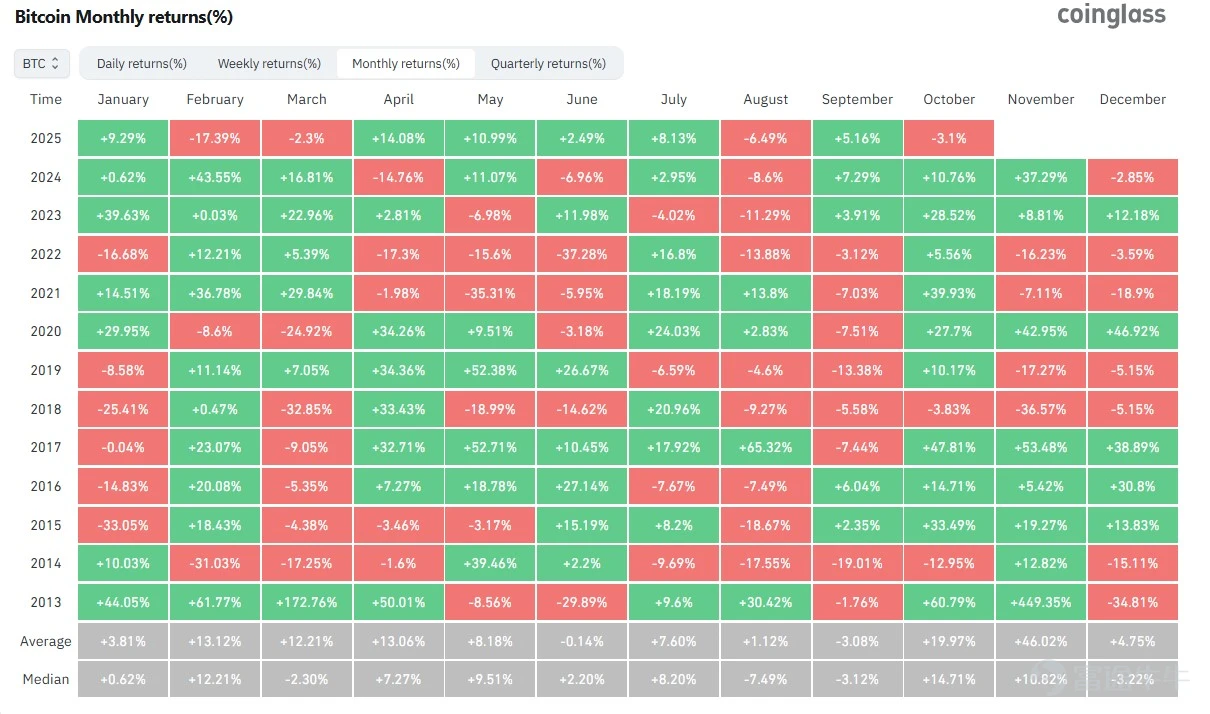
Source: Coinglass website, as of 9:54 a.m. on October 21.
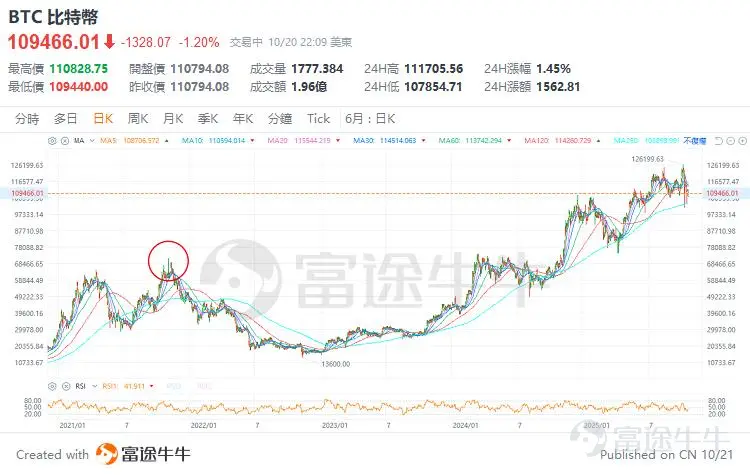
During the last bull market in 2021, Bitcoin peaked in November (see the chart below), leaving many investors concerned that there may not be much time left to trade this year. However, this year's market conditions are particularly unique: back then, monetary policy was characterized by "rate hikes + balance sheet reduction," whereas now it is under the premise of "rate cuts + the impending end of balance sheet reduction." At that time, the U.S. government was strongly opposed to cryptocurrencies, while today it is more supportive than ever. Back then, Wall Street capital barely entered the space; now, major countries worldwide are actively advancing crypto‑related policies and issuing stablecoins. Against this backdrop of dramatic changes, Bitcoin may be poised to enter an unprecedented super‑bull cycle.
Bitcoin has five key conditions for sustained growth: 1) Based on historical cycles, the probability of Bitcoin rising in October is as high as 80%; 2) Currently, favorable policy momentum is strong, with major global economies all supporting the development of cryptocurrencies, which could extend its bull market cycle.
3) Institutional capital continues to flow steadily into crypto assets, ETFs$ProShares Bitcoin ETF(BITO.US)$ $Bitwise Bitcoin ETF(BITB.US)$ $Invesco Galaxy Bitcoin ETF(BTCO.US)$ $CoinShares Bitcoin ETF(BRRR.US)$ $ChinaAMC Bitcoin ETF(03042.HK)$ $Monochrome Bitcoin ETF(IBTC.AU)$ $Bosera HashKey Bitcoin ETF-U(09008.HK)$ $CSOP Bitcoin Futures ETF(03066.HK)$1. DAT Company continues to absorb circulating supply from the market; 4) With Bitcoin's supply halving and demand surging, supply and demand have become severely imbalanced, driving prices higher; 5) As the market structure improves and Bitcoin's market capitalization expands, volatility has declined, attracting more capital into the space.
Compared with the 2021 bull market, the current environment has improved fundamentally: monetary policy has shifted from tight to loose, political attitudes have moved from opposition to support, and institutional capital has transitioned from a wait-and-see stance to large-scale entry, potentially transforming Bitcoin from a niche, high-risk asset into a mainstream store of value. Most crucially, the current U.S. president is more supportive of the cryptocurrency market's development than anyone else, giving reason to believe that the four-year halving cycle may be extended under a Trump-led administration.
How much does Bitcoin have to be priced at for me to get in?
For investors, the question "How much does Bitcoin have to cost before I can get in?" is often asked. Currently, only about 5% of the world's population holds BTC, so we're still in the early stages of entering the market. October's "Uptober" may just be the beginning, and Bitcoin's supercycle could officially be underway.
Feng Wenhui, Senior Analyst at Futu Securities
(The author is a licensed person with the China Securities Regulatory Commission, and neither the author nor any of their associates holds any financial interest in the recommended issuer.)
How do you buy Bitcoin?
Futu Securities is a licensed entity regulated by the Hong Kong Securities and Futures Commission, offering virtual asset trading services that enable one-stop trading of cryptocurrencies, cryptocurrency spot ETFs, futures ETFs, and related concept stocks. Futu currently supports trading in Bitcoin and Ethereum.
More popular cryptocurrencies will be added one after another—stay tuned.

Cryptocurrency ETF
Finally, in addition to directly trading cryptocurrencies, investors can also do so through the stock market.Using ETFs to Invest Directly in Cryptocurrencies。
Bitcoin ETF:
Ether ETF
Shorting Bitcoin ETFs
Bitcoin Price Trend Analysis (May 2025)
Looking back at the views expressed in the previous article, both Bitcoin and Ethereum have performed far beyond the author's expectations during this period; however, at that time regarding…$T-Rex 2X Long MSTR Daily Target ETF(MSTU.US)$or$CSOP MicroStrategy Daily (2x) Leveraged Product(07799.HK)$Short-term trading allocations have also risen by more than 30%.
As for the latest developments, the market is primarily focused on U.S. Treasury bonds. This week, rating agencies once again downgraded U.S. Treasuries, with all three major agencies no longer assigning them the top "AAA" rating. Consequently, the risk of a U.S. debt default has drawn renewed attention, and investors broadly expect these issues and concerns to persist through June. As a result, equity markets have come under pressure amid rising bond yields, with U.S. stocks…$S&P 500 Index(.SPX.US)$And Hong Kong stocks$Hang Seng Index(800000.HK)$Nor can one remain unaffected.
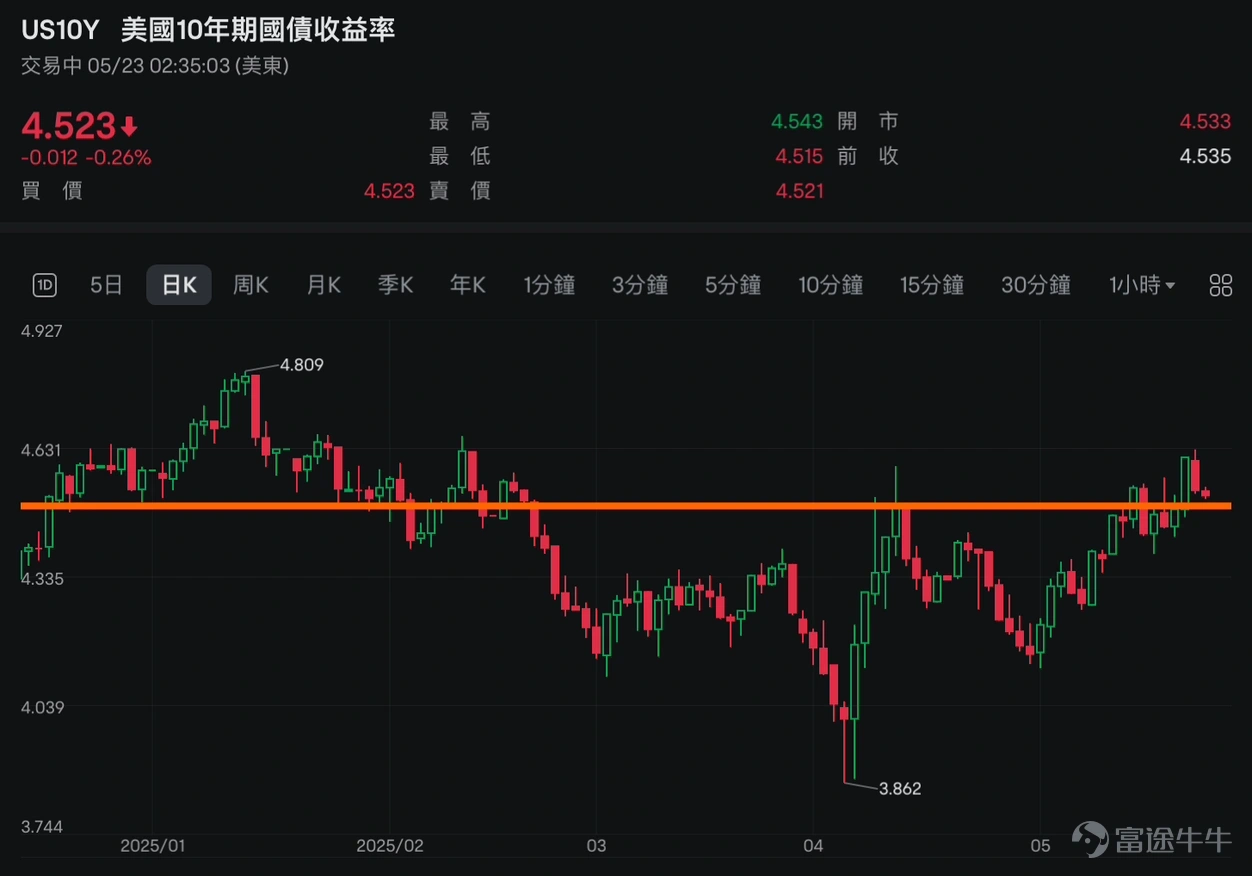
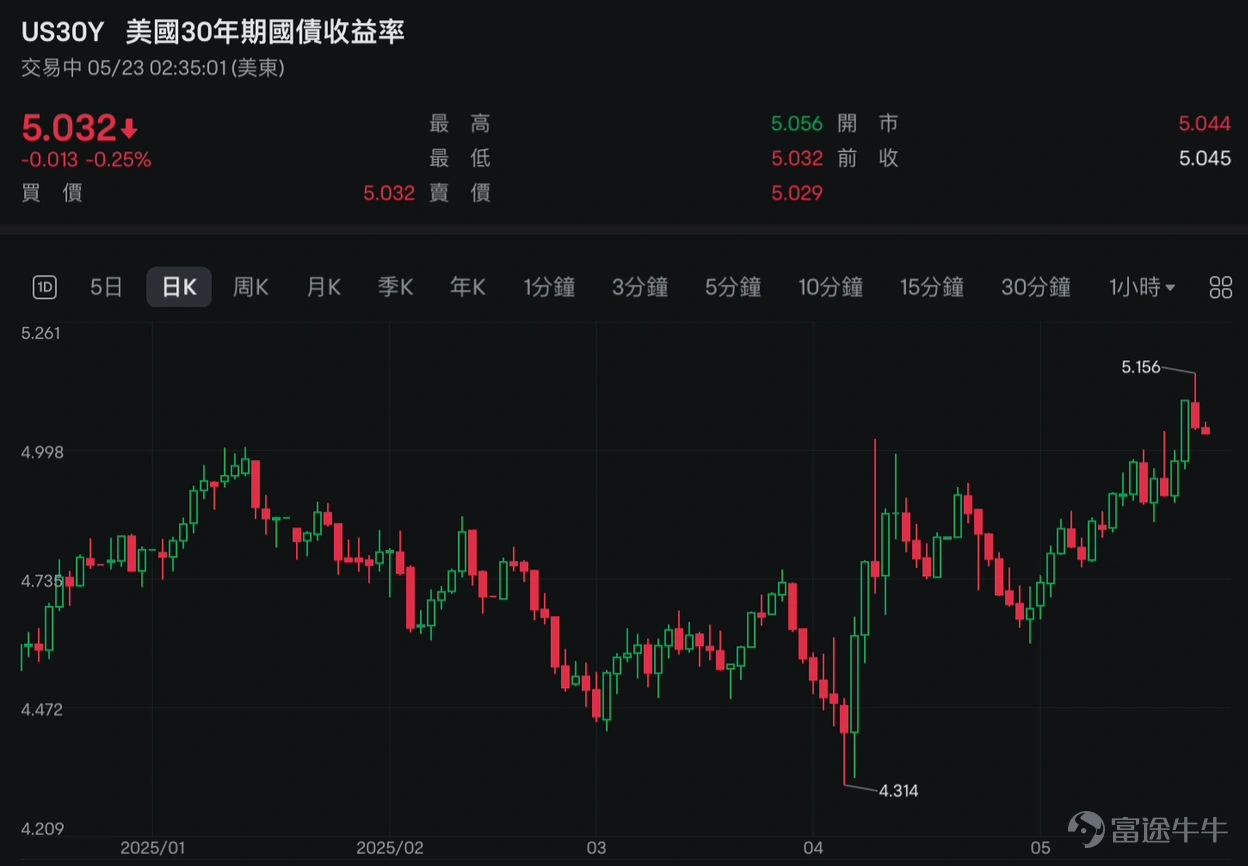
However, judging from the latest economic data, the risk of a global recession remains manageable, with short-term concerns primarily centered on U.S. debt and the budget deficit. This has led to capital not fleeing across the board for safe-haven assets; instead, it's flowing into "de-dollarization"–related assets. From this perspective, we can fully explain Bitcoin's price action and gold prices.$Gold Main Contract (GCmain.US)$The reasons behind this week's strong market momentum.

The latest outlook and technical analysis on Bitcoin
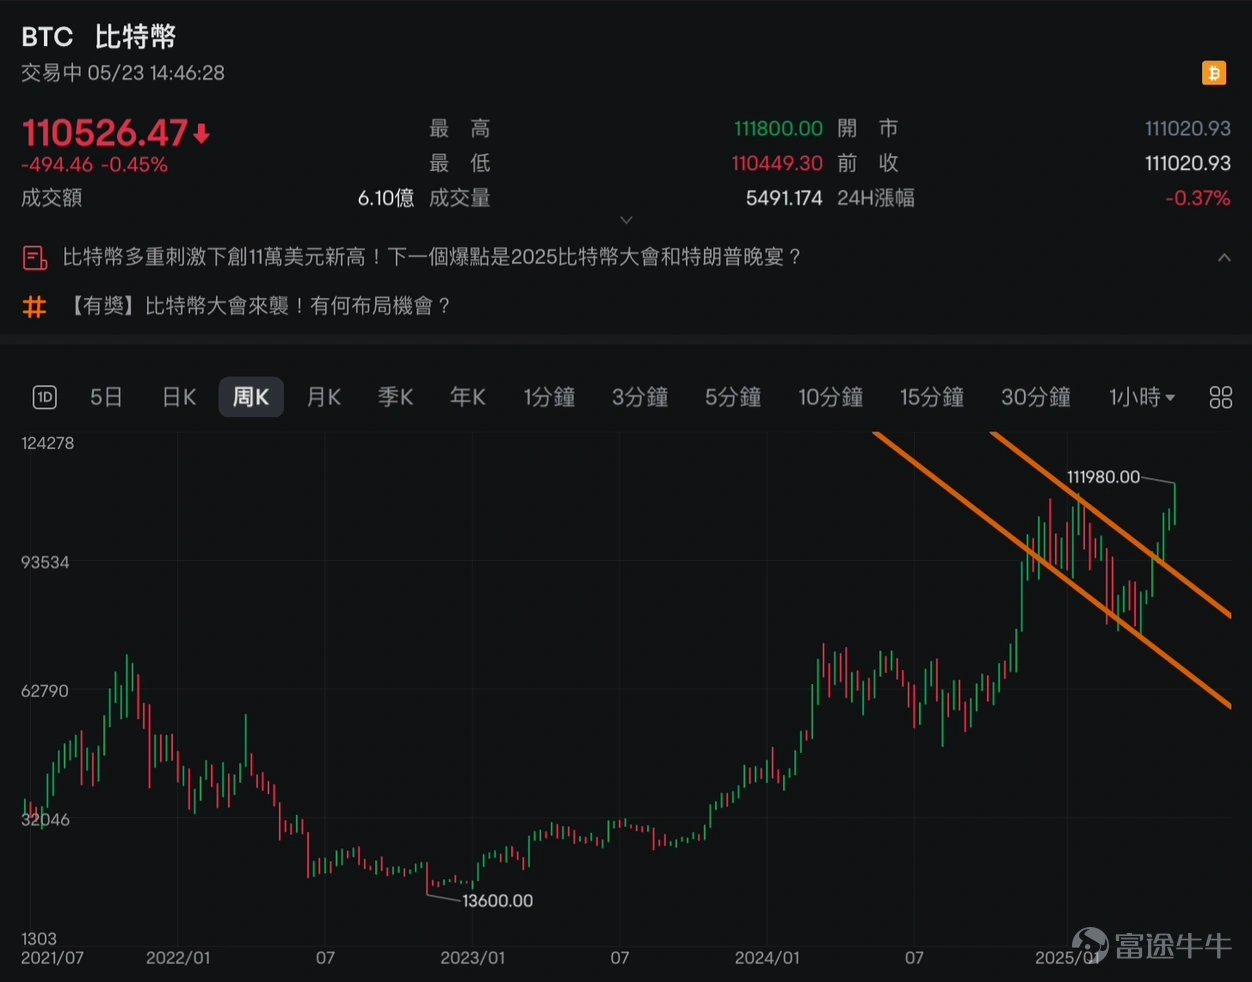
Under the banner of "de-dollarization," Bitcoin's price began to shake off its weakness in the second quarter of this year. As shown on the weekly chart above, the price officially resumed its upward trend three weeks ago, with the first short-term target hovering near last year's projected level of 120,000. For more details, you can revisit the end of last year's…Bitcoin breaks $100,000 again—could there be buying opportunities soon?」。
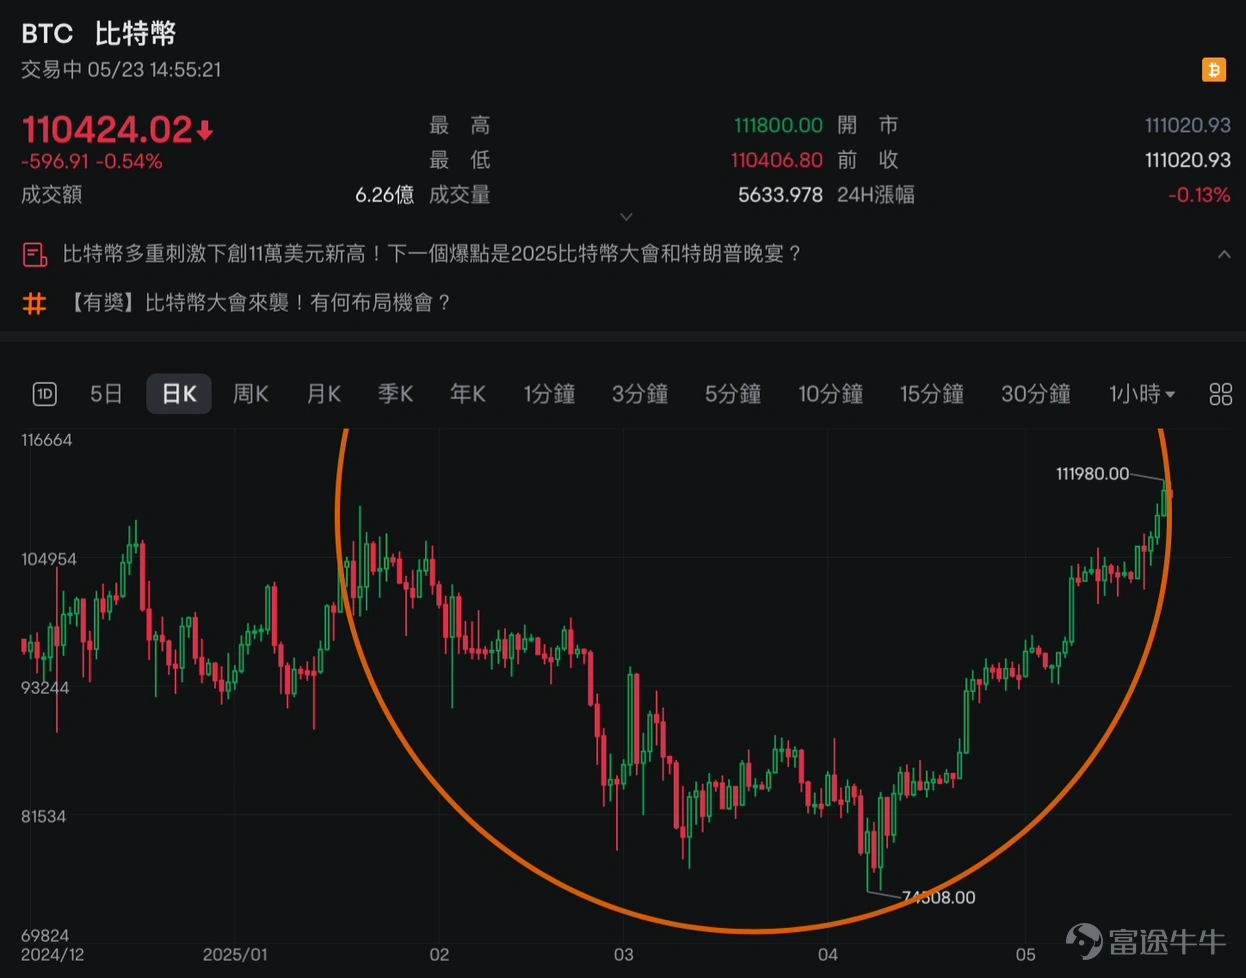
In the latest outlook, considering that Bitcoin has completed a healthy correction from its January 20 high of $109,640, it appears to be forming a "round bottom" pattern. During the correction, the price dipped as low as $74,508; based on the measured move, the medium-term target could rise to around $144,000.
However, it's worth noting that prices have recently accumulated substantial gains, and the aforementioned medium-term target hinges on maintaining stability above the neckline at $109,640. In the short term, if the price briefly breaks below the neckline, the chart pattern could shift from a "round bottom" to a "cup-and-handle formation." Moreover, the moving averages have already entered a "bullish arrangement," creating a typical scenario of strong rallies with limited pullbacks. Given Bitcoin's volatility, staggered accumulation is a more prudent approach, as the cost of gradually building positions tends to be more manageable.
January 2025 Bitcoin Trend Analysis and Forecast
This weekend, the crypto world witnessed a flurry of events: ahead of his return to the White House, Donald Trump and his wife each launched their own personal meme coins—Trump Coin and Melania Coin. Some investors may not fully grasp the details; for more information, be sure to check out Futu News today's "The Trumps have both "minted their own tokens," and their family‑affiliated projects continue to ramp up their holdings of Ether, heralding a new turning point for the global cryptocurrency market.」。
In summary, leveraging his presidential status and enduring popularity, Trump's launch of a related cryptocurrency has created surging demand—exactly the kind of speculative hype typical of meme coins. As some financial institutions have noted, whether this situation involves serious conflicts of interest or the exploitation of his presidential office for personal gain is a matter for U.S. law to determine. One clear takeaway is that Trump is undoubtedly the most pro‑cryptocurrency U.S. president in history. This episode may also help refine future crypto‑regulation, further stabilizing the development of digital assets. Trump was also instrumental in last week's…$Solana (SOL.CC)$The reasons behind the significant price surge. Moreover, as more regulatory measures are introduced, the market is anticipating the launch of SOL‑related ETFs this year.
For investors, some mainstream cryptocurrencies such as...$Bitcoin (BTC.CC)$and$Ether (ETH.CC)$It remains a key asset of focus this year.
In addition to the related MeMe coin being hyped, BTC also broke its all-time high today. As the broader market anticipates more favorable policies or regulations for cryptocurrencies in the future, investors expect a sharp increase in demand from financial institutions for mainstream cryptocurrencies like BTC and ETH—key factors supporting upward price momentum. With that in mind, let's revisit some fundamentals to refresh our understanding.
Bitcoin
Fundamentals:
The supply is capped at 21 million coins.
Currently, over 92% of Bitcoin has been mined.
In roughly four years, the halving will occur, leading to supply constraints.
The largest cryptocurrency by market capitalization accounts for approximately 58% of the total crypto market cap.
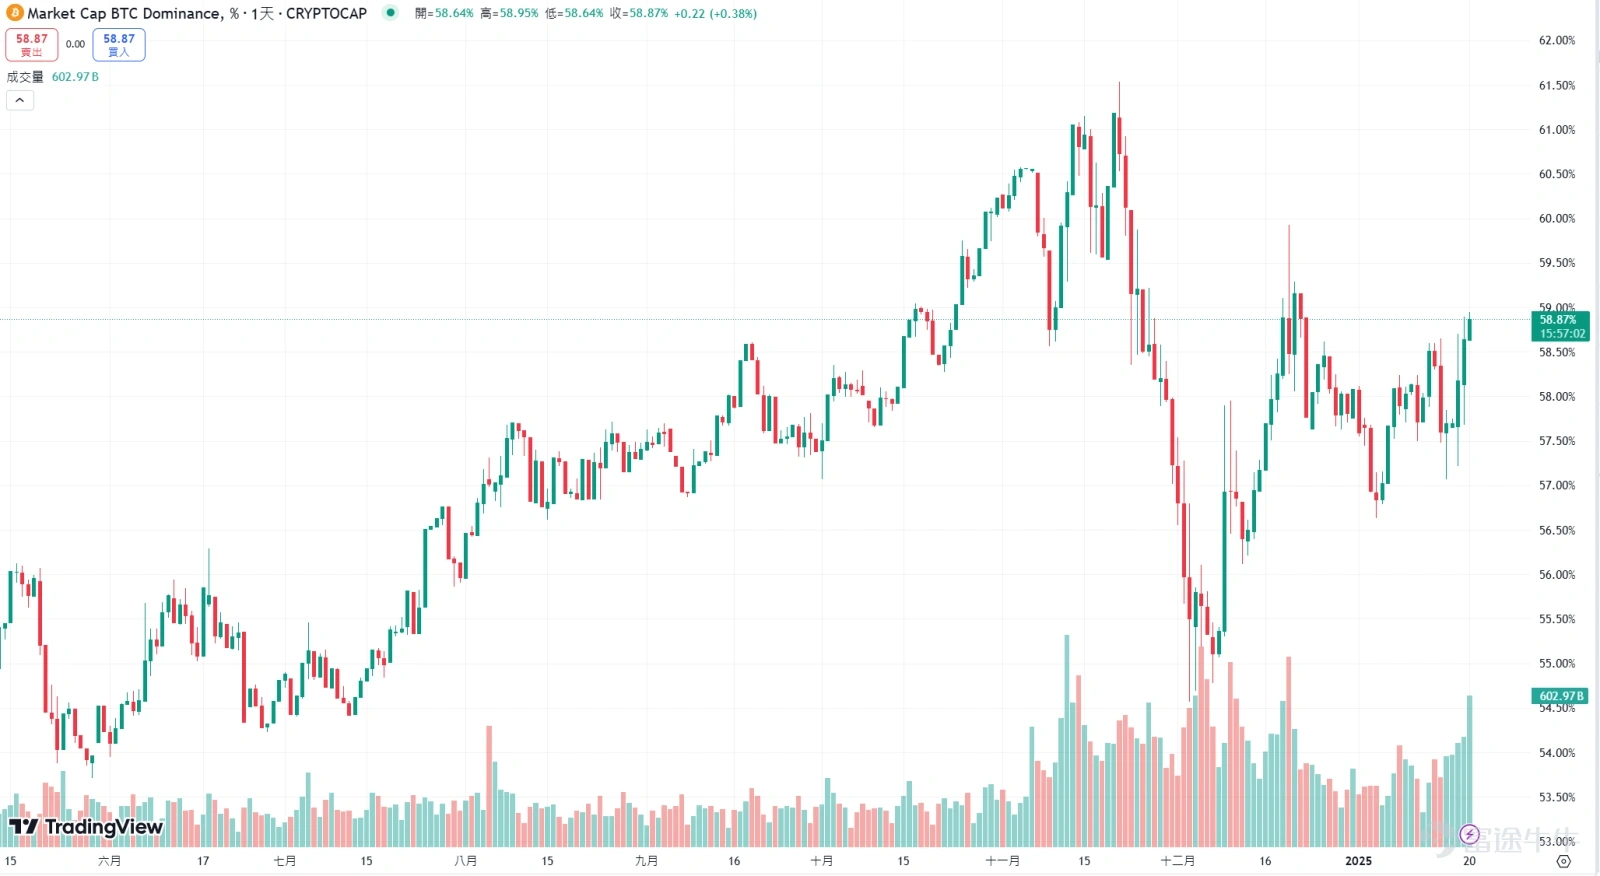
Investment Highlights:
Rarity
As other cryptocurrencies have surged recently, their market capitalization as a share of the overall crypto market has retreated from its historical peak, leaving room for short-term catch-up rallies.
Trump's policies are expected to encourage more financial institutions to increase their holdings in the coming market, with the potential to supplant gold as an investment theme.
Technical trend breakout
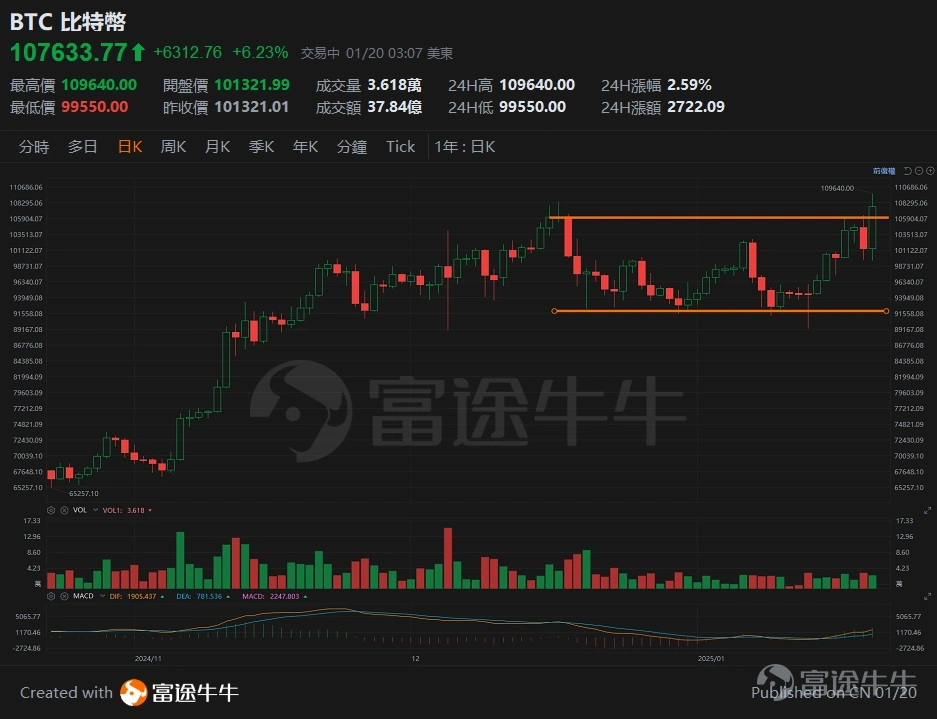
Technical Analysis: Just broke out of a sideways trading range.
First support level: $106,000
Key support level: $100,000
Measurement of the increase target: USD 120,000 (106,000 - 92,000 - 14,000; 106,000 + 14,000 = 120,000)
Ether
Fundamentals:
– Transaction speed far surpasses Bitcoin, with broader applications.
– There is no upper limit, but a deflationary mechanism has been introduced.
– Proof of Stake consensus mechanism
– The second-largest cryptocurrency by market capitalization, accounting for approximately 11% of the total crypto market cap.
Investment Highlights:
– The development of digital assets and the growth of their application ecosystem are even more promising.
– Trump's Travel Crypto Project Is Increasing Its Holdings
– Technical trend poised for a breakout
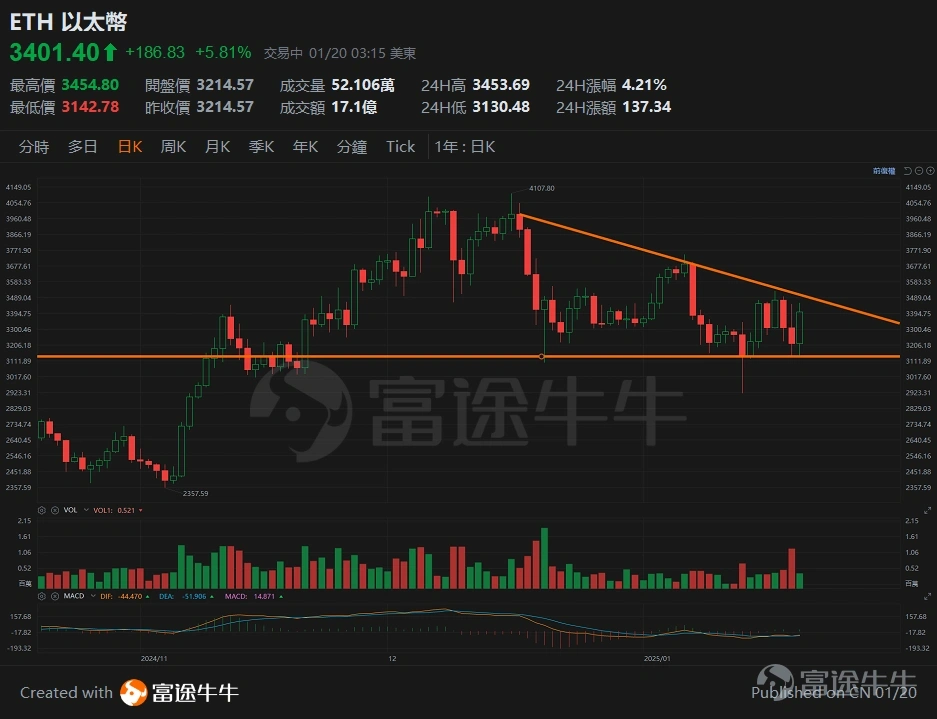
Technical Analysis: Preparing for a Breakout; the MACD Has Just Issued a Golden Cross Signal.
First resistance level: $3,700
Key resistance level: $4,100
Support level: $3,130
Key support level: $3,000
The following is an introductory guide to Futu's cryptocurrency trading:


December 2024 Bitcoin Trend Analysis and Forecast
The author remains optimistic about cryptocurrency market trends, with an overall outlook largely unchanged from previous assessments. Recent developments have been plentiful and warrant further discussion. One of the market's key focal points is December 5th.$Bitcoin (BTC.CC)$After hitting an all-time high of $104,112, it subsequently retraced from that peak and briefly plunged to $91,808. Although the decline quickly stabilized, it nonetheless sparked concerns in the investment market about Bitcoin's liquidity risk.
Recent news' impact on Bitcoin analysis
Looking back at the news, hours after Bitcoin hit an all-time high, former U.S. Treasury Secretary Lawrence Summers recently stated that there is no need to establish a Bitcoin reserve and called the idea "crazy." In an interview with foreign media, he said, "Apart from serving the interests of certain political patrons, I see no benefit in setting up a national Bitcoin reserve." Given that at the time, the U.S. and Russia were using Bitcoin as a strategic reserve, driving its price to record highs, it was only natural that this news triggered selling pressure.
In addition to being an economics professor at Harvard University, Summers is also a member of OpenAI's board of directors, wielding considerable influence in the financial and economic spheres. However, it's worth noting that he is not pessimistic about the development of cryptocurrencies; rather, his concerns are directed primarily at the Trump administration's practice of establishing strategic reserves. This does not mean that the investment rationale behind cryptocurrencies has become inflated; more importantly, it aims to prevent certain speculators from exploiting Bitcoin's scarcity—limited to just 21 million coins—as a marketing gimmick. This view is one with which I personally disagree.$Strategy(MSTR.US)$The operating approach is similar, and the rationale for remaining bullish on Bitcoin's price is also alike.
However, following those remarks, enthusiasm for the "Trump trade" has cooled, and markets are now focused on the Federal Reserve's December 18 policy meeting. While a 25-basis-point rate cut on that date is widely expected, investors are closely watching the Fed's forward guidance and the scope for further easing. The stance of Fed officials and their views on the incoming administration will be key market drivers. In particular, comments on the economic outlook could significantly influence risk‑asset prices, especially cryptocurrencies, which have been trading at elevated levels recently.
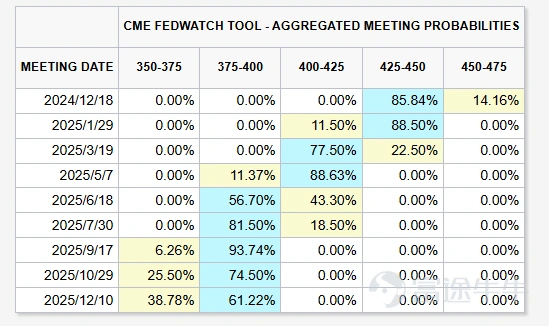
(Resource source: CME FedWatch, December 11, 2024)
Although the direction and practices of strategic reserves are being challenged, in the short term, institutional hoarding of Bitcoin is unlikely to change significantly, which will support Bitcoin's overall price performance. With more robust regulatory measures taking effect next year, this will further bolster the performance of cryptocurrencies. You can refer to the latest market views from the following institutions.

Bitcoin Technical Analysis and Price Forecast
When it comes to the deployment of the two major mainstream cryptocurrencies, Bitcoin and Ethereum, I still recommend adopting a technical analysis approach, covering both short-term and medium-to-long-term perspectives. Below is my current view on Bitcoin.
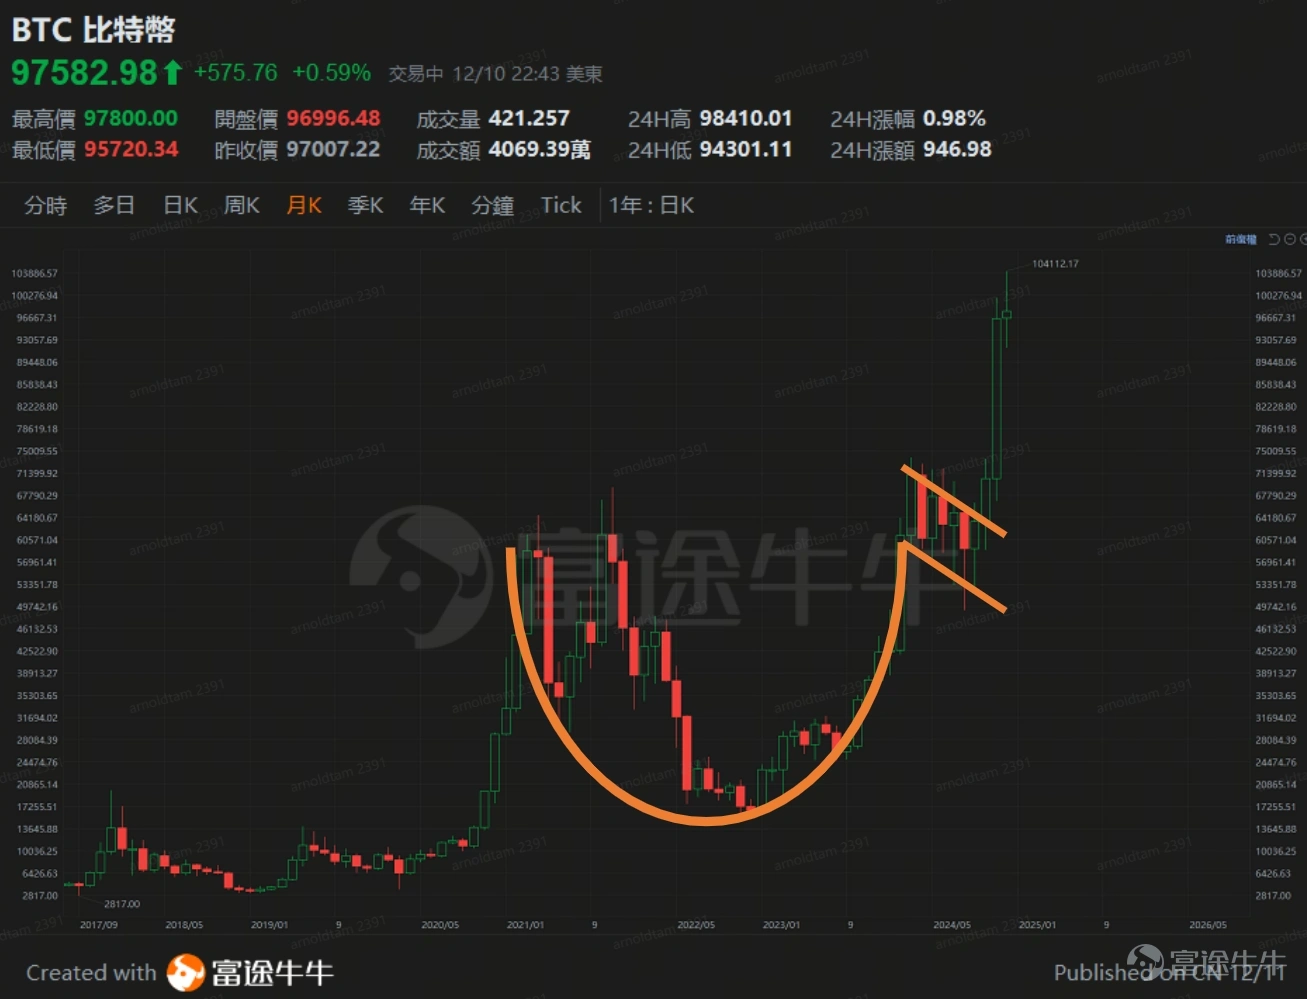
On the monthly chart, Bitcoin has formed a clear "cup-and-handle" pattern. It's important to note that this pattern is primarily based on the monthly timeframe and should be used only as a reference for medium- to long-term targets, not as a guideline for short-term trading. Based on the chart above, referencing the previous rounded bottom at around $16,000 and the 2021 high of $69,000, a measured move could potentially push prices toward $122,000.
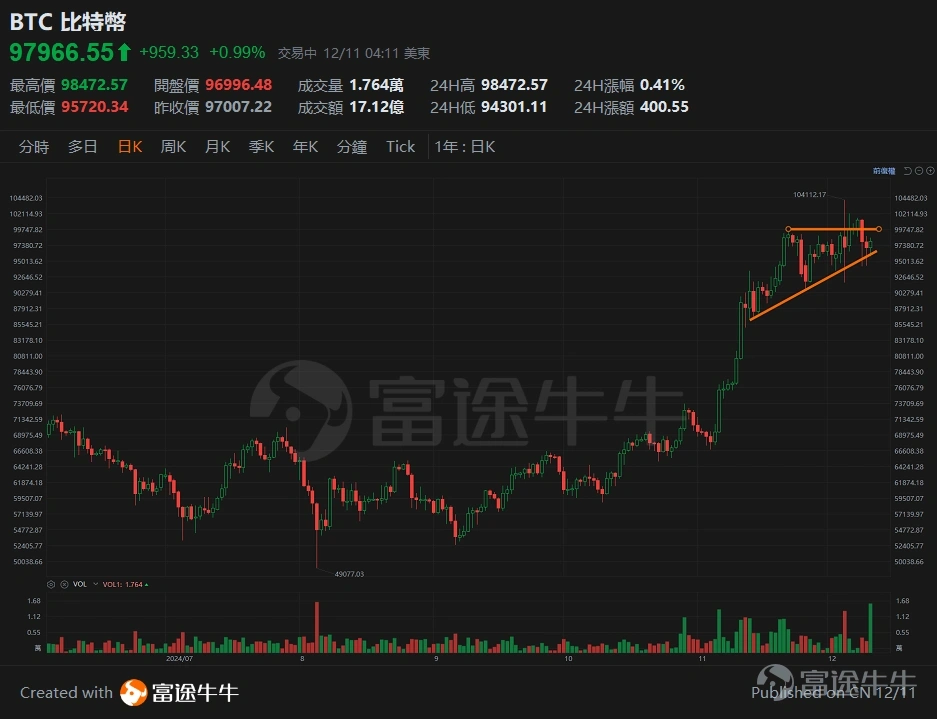
Short-term trading strategy
As for short-term trading, it's best to use the daily chart for analysis. From the chart above, Bitcoin's price has pulled back from its recent high but remains within an ascending triangle pattern, indicating a situation that's still pending a breakout. From a trend-following perspective, as long as the near-term market continues to hold above the aforementioned short-term uptrend line—around $95,000 or higher—we can still look forward to a potential breakout. Moreover, with substantial volume recently supporting the move, it's really not advisable to be overly pessimistic in the short term. If BTC manages to break through the $100,000 mark again, based on the high of $99,800 reached on November 22 before the pullback, and using the first point of the uptrend—the low of $90,742 on November 26—as a reference, the projected target could reach $108,858.
November 2024 Bitcoin Trend Analysis and Forecast
The one I posted last November 7th "New Trends in Trump-Related Trading After the ElectionSince then, the cryptocurrency market has remained buoyant. A range of developments have fueled the rally, including Tesla CEO Elon Musk's endorsement of Bitcoin amid Donald Trump's electoral surge, the new administration's support for and regulatory framework surrounding cryptocurrencies, and the simultaneous entry of numerous institutions into the crypto space—each contributing to the sector's robust performance.
Recently$Bitcoin (BTC.CC)$It even aims squarely at the $100,000 mark (at the time of writing, in fact...).$Bitcoin Reference Exchange Rate Main Chain (BTCmain.US)$(It has once risen above $100,000.) This time, we'll try to understand the market trends first before learning Bitcoin analysis.
How to analyze Bitcoin-related concept stocks
Bitcoin analysis shows that Bitcoin-related stocks have diverged in performance; during this period, as Bitcoin aims for $100,000, and$Ether (ETH.CC)$And some ALTCOINS experienced a frenzied bull phase in the early stages of the market, driving related concept stocks to surge one after another. As mentioned in the Bitcoin analysis...$Coinbase(COIN.US)$ 、 $MicroStrategy (MSTR.US)$ 、 $MARA Holdings(MARA.US)$It also surged along with the market rally. Among them, MSTR was the hottest performer; in addition to benefiting from the sharp rise in the price of its accumulated Bitcoin holdings, the company issued bonds to further increase its Bitcoin position, adding fuel to the fire. In November, MSTR's stock price climbed from a pre-election low of $220.82 to a November 21 high of $543, posting a cumulative gain of about 146%; the two‑times leveraged ETFs MSTX and MSTU also rose by over 429% and 407%, respectively. The red-hot market has drawn widespread attention and prompted various companies—both U.S.-listed and Hong Kong‑listed—to emulate MSTR's business model, which is a key reason why Bitcoin prices have remained particularly strong since the election.
As Citron Research posted on the social platform X, it remains bullish on Bitcoin's prospects but is hedging by shorting MSTR. This news sent the stock sharply lower after hitting a intraday high last night, and related concept stocks also underperformed the broader crypto market. In my view, the key distinction lies in the nature of the assets: Bitcoin is primarily driven by tight supply-and-demand dynamics, whereas equities are evaluated based on price-to-earnings ratios, profitability, and business models. Consequently, a simple rally in Bitcoin prices alone does not provide a solid foundation for sustained share-price gains. Moreover, as noted above, these stocks have surged far more than cryptocurrencies, so a temporary, exaggerated correction is hardly surprising.
Currently, the related concept stocks are exposed to "non-systematic risk" (in simpler terms, company-specific operational risk), and short-term trading risks remain elevated. For now, we recommend focusing primarily on cryptocurrencies.
Bitcoin Analysis: Macro Analysis
Following the Red Sweep, calls for supporting digital assets have grown louder. This month has seen numerous bills related to cryptocurrencies or digital assets, all proposing to hold Bitcoin as a strategic reserve. Given Bitcoin's scarcity—only 21 million coins in total—this is a key factor driving BTC toward the $100,000 mark. In the run-up to the new U.S. administration taking office, the market is expected to remain highly sensitive to news concerning cryptocurrencies.
It's worth noting that Bitcoin's limited supply is almost universally known, but when it comes to the development of digital assets and Web3.0, Bitcoin alone cannot support the entire digital asset ecosystem. Although its scarcity helps stabilize prices, its application performance suffers significantly—for example, its "transactions per second" is relatively weak. If we want to drive the growth of digital assets, demand for Ethereum and certain altcoins will likely resurge.
Finally, it's worth noting that although Ethereum has no hard cap on its supply, under the new Proof-of-Stake consensus mechanism, its future supply remains limited and controllable. As demand for digital assets grows, this will inevitably lead to a supply shortage—explaining why ETH has once again been catching up recently.
Bitcoin analysis and Ethereum outlook
The author believes that, given the current bullish market sentiment, attempting to trade Bitcoin near the $100,000 level would be rather awkward. If one does decide to buy Bitcoin, the best approach is to adopt a gradual accumulation strategy for medium- to long-term investment. Considering that Bitcoin transactions are denominated in increments as small as 0.0003, cryptocurrency trading naturally lends itself to fractional purchases. Coupled with Bitcoin's unique scarcity, this strategy can effectively help balance entry risks—though investors should be prepared to take a long-term perspective.
In terms of short-term positioning, I personally prefer using technical analysis to trade Bitcoin, with a particular focus on ETH's performance, mainly because ETH tends to be more volatile. Although its price hasn't been hitting new all-time highs like Bitcoin, it's easier to identify resistance and support levels.
Technical Analysis Perspective
Bitcoin technical analysis insights
(As of November 22, around 15:00)
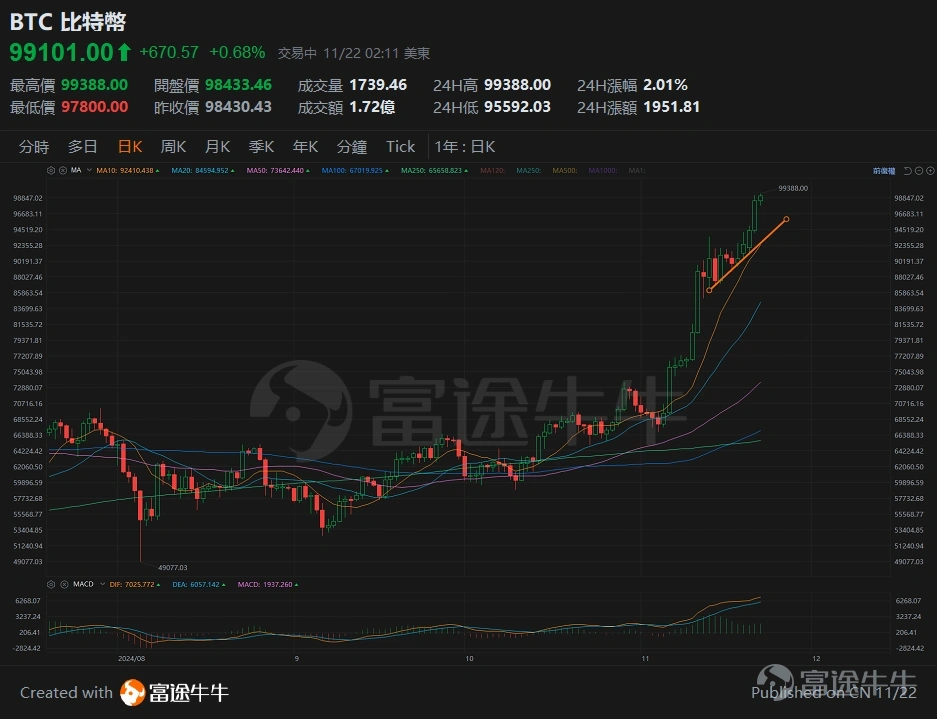
Bitcoin has been exceptionally strong lately, and having already reached all-time highs, it's difficult to identify the next resistance level or target price on the daily chart. As for support, one can look around the 10-day moving average or the short-term uptrend line near $92,400. Frankly, these levels don't carry much reference value.
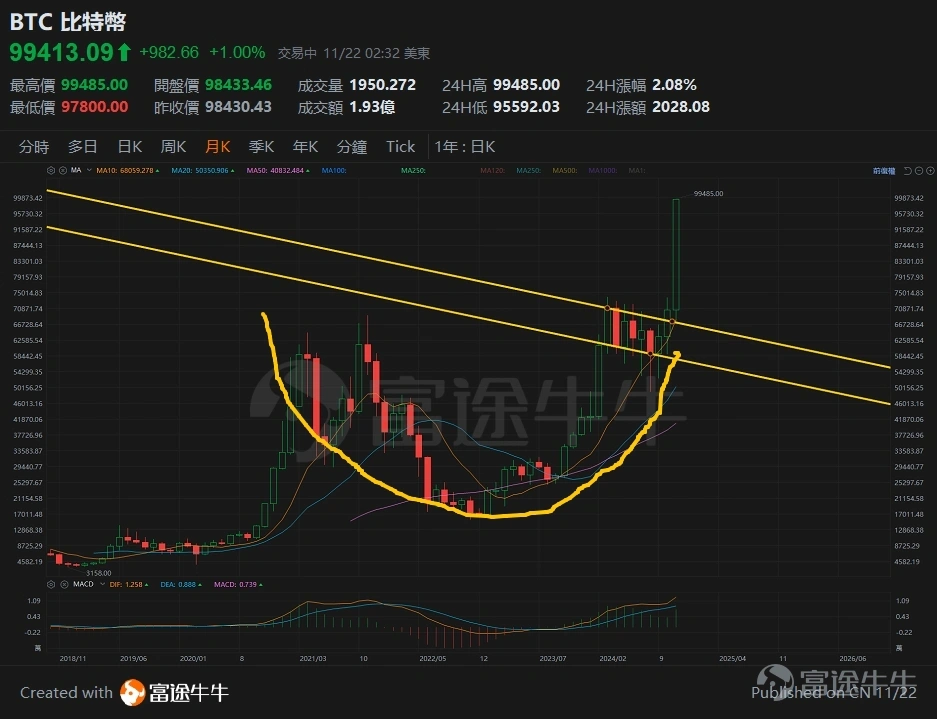
On the monthly chart, since Bitcoin broke its all-time high, a "Cup & Handle" pattern has emerged. Based on past round-bottom formations, the bottom was around $16,000, and the 2021 high was at $69,000; using the measured move method, it could potentially challenge $122,000.
It should be noted that the above outlook is based primarily on the monthly chart, and short-term deviations may be quite substantial; therefore, this price target should not be overly relied upon. This is also why one should approach Bitcoin purchases with a "HODL" mindset.
Ethereum Technical Analysis Insights
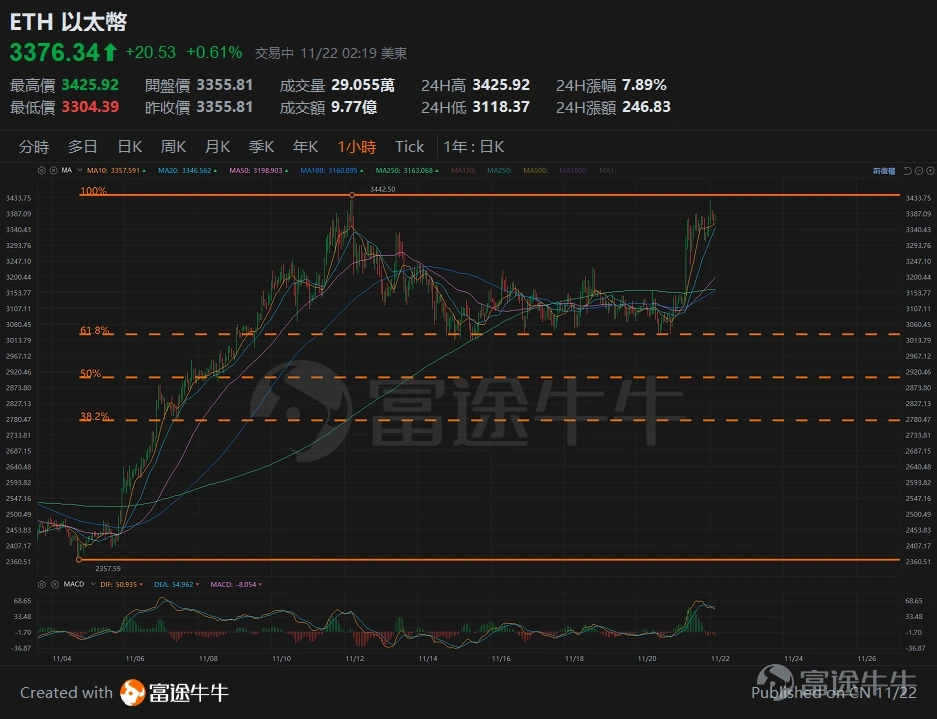
As for Ethereum, I believe traders can use the hourly chart as a basis for positioning. Following my previous article, which suggested that ETH could reach $3,400, the price briefly retraced to near $3,000. The chart above shows that the pullback only retraced 38.2% of the prior move, and more recently, the price has stabilized and resumed its upward trend. If it breaks above the previous high of $3,442, this would confirm a healthy correction and signal a resumption of the uptrend.
From a short-term trading perspective, it's easier to set stop-loss levels and price targets when buying ETH. Use the previous sideways‑range top around 3,200 as a key support level; if the price doesn't break below it, trade with the trend. If the price breaks above $3,442, the next target can be calculated by measuring the upward move: 3,442 – 3,014 = 428; 3,442 + 428 = $3,870—roughly the high of another wave in late May this year.
Author Information
Tan Zhile
Chief Analyst at Futu Securities
CE No. Central Number: AVJ390
(The author is a licensed person with the China Securities Regulatory Commission, and neither the author nor any of their associates holds any financial interest in the recommended issuer.)