Technical indicators
Futubull provides a wealth of technical indicators, supports user-defined indicator parameters, self-editing indicators, and helps investors analyze stock trends. The indicators are divided into main chart indicators and sub chart indicators. The candlestick chart is the main chart, the one below the main chart is the sub chart, and multiple sub charts can be opened.
1. Mobile phone
1.1 In portrait mode, click the items below the sub-chart to switch indicators;
1.2 In landscape mode, click the indicators icon to view and switch frequently used indicators;
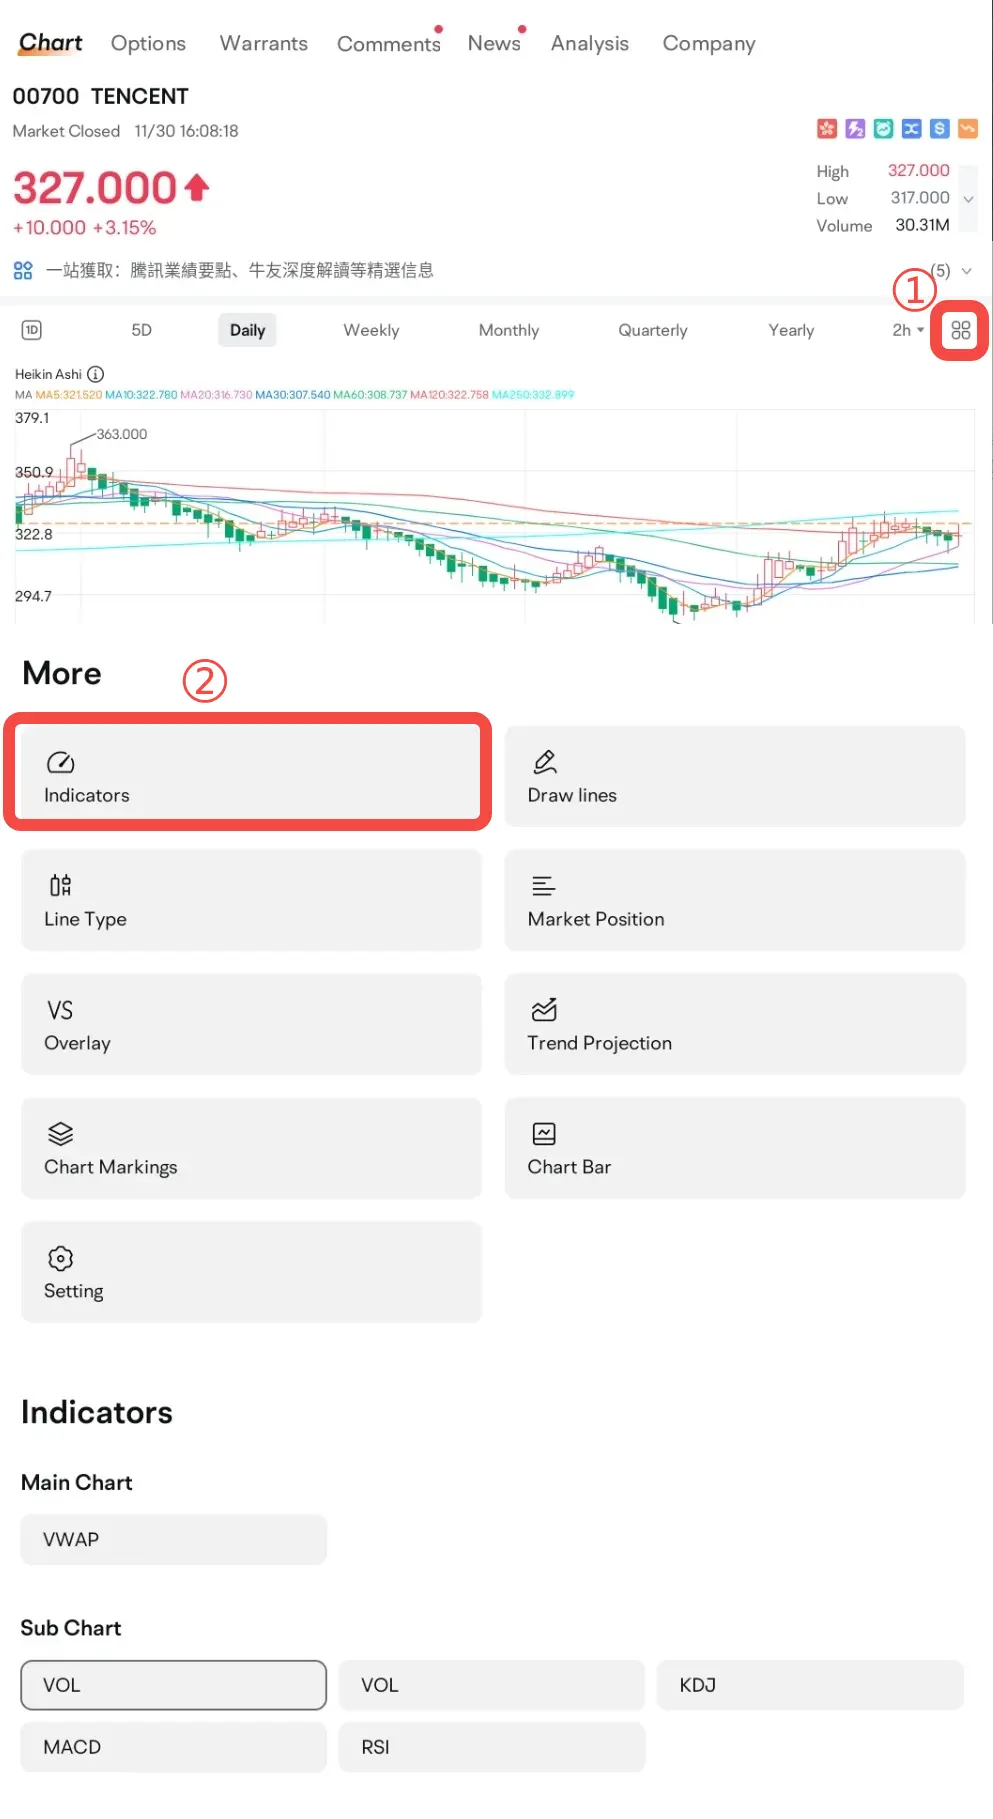
1.3 Indicator management: Button in the upper right corner of the chart - Indicators;
2. Desktop
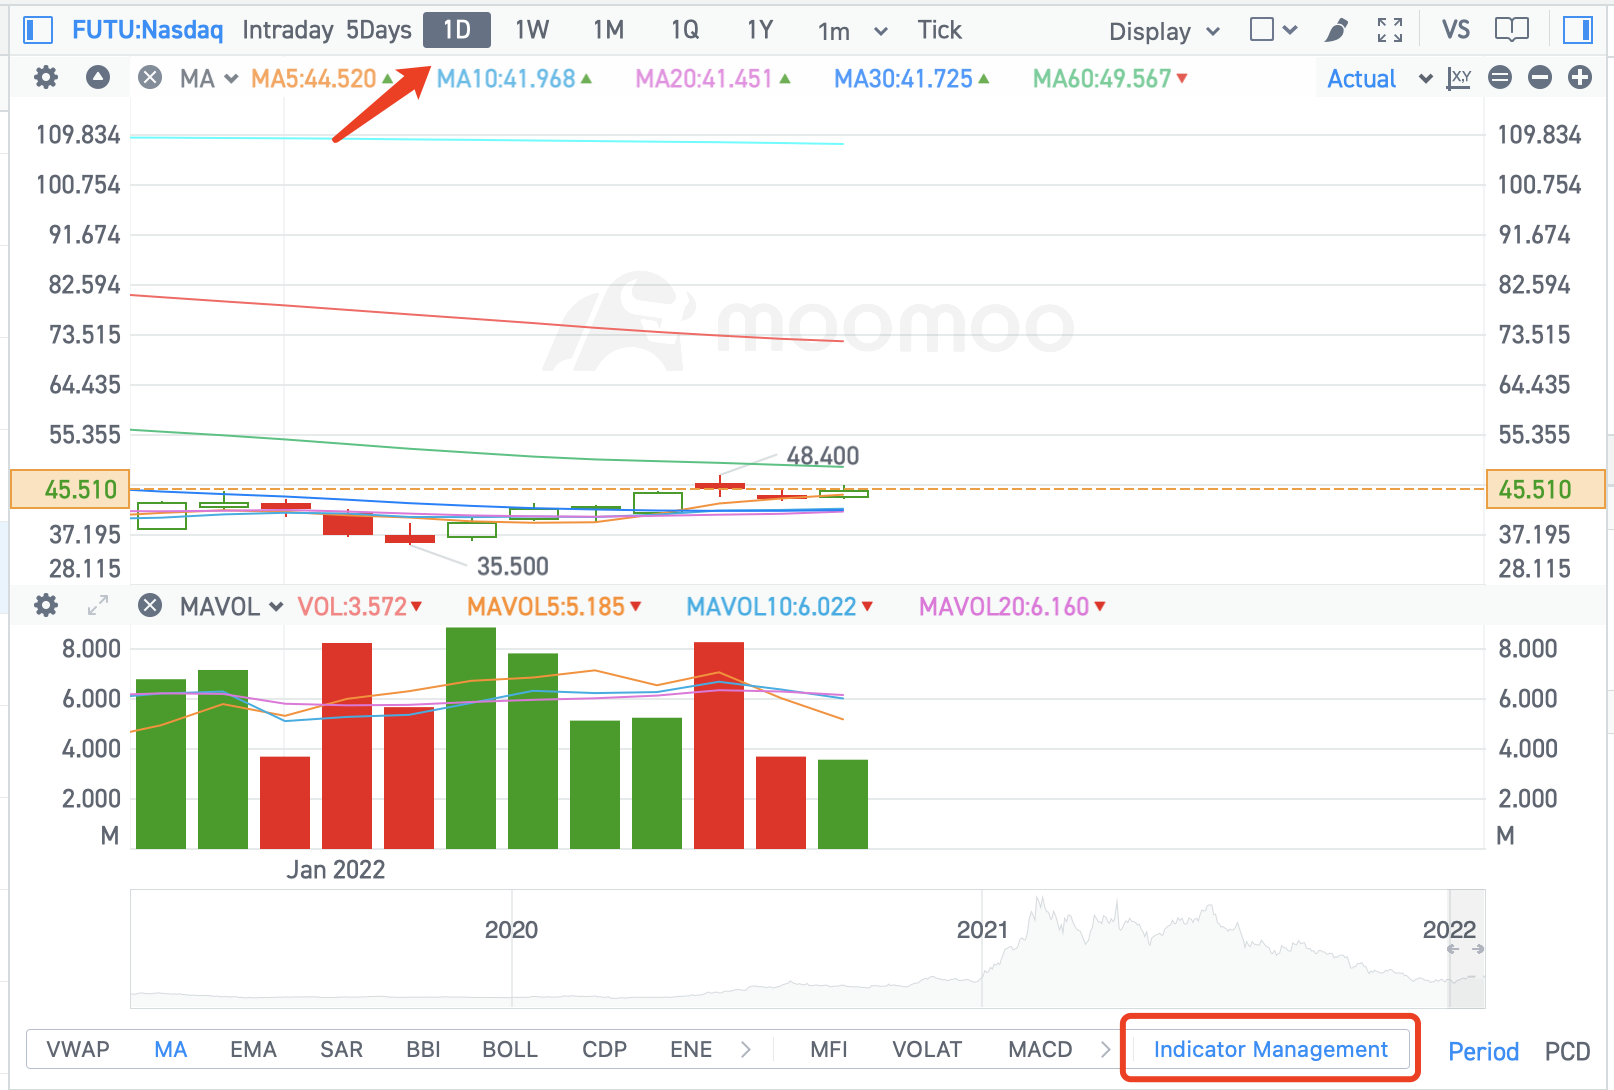
2.1 The indictor's name and current value are displayed on the indicator bar, click the curve name to hide or display.
2.2 Click the setting button of the indicator bar, and the indicator parameter settings will pop up. You can set the indicator parameters, color, thickness, display and hidden, etc.
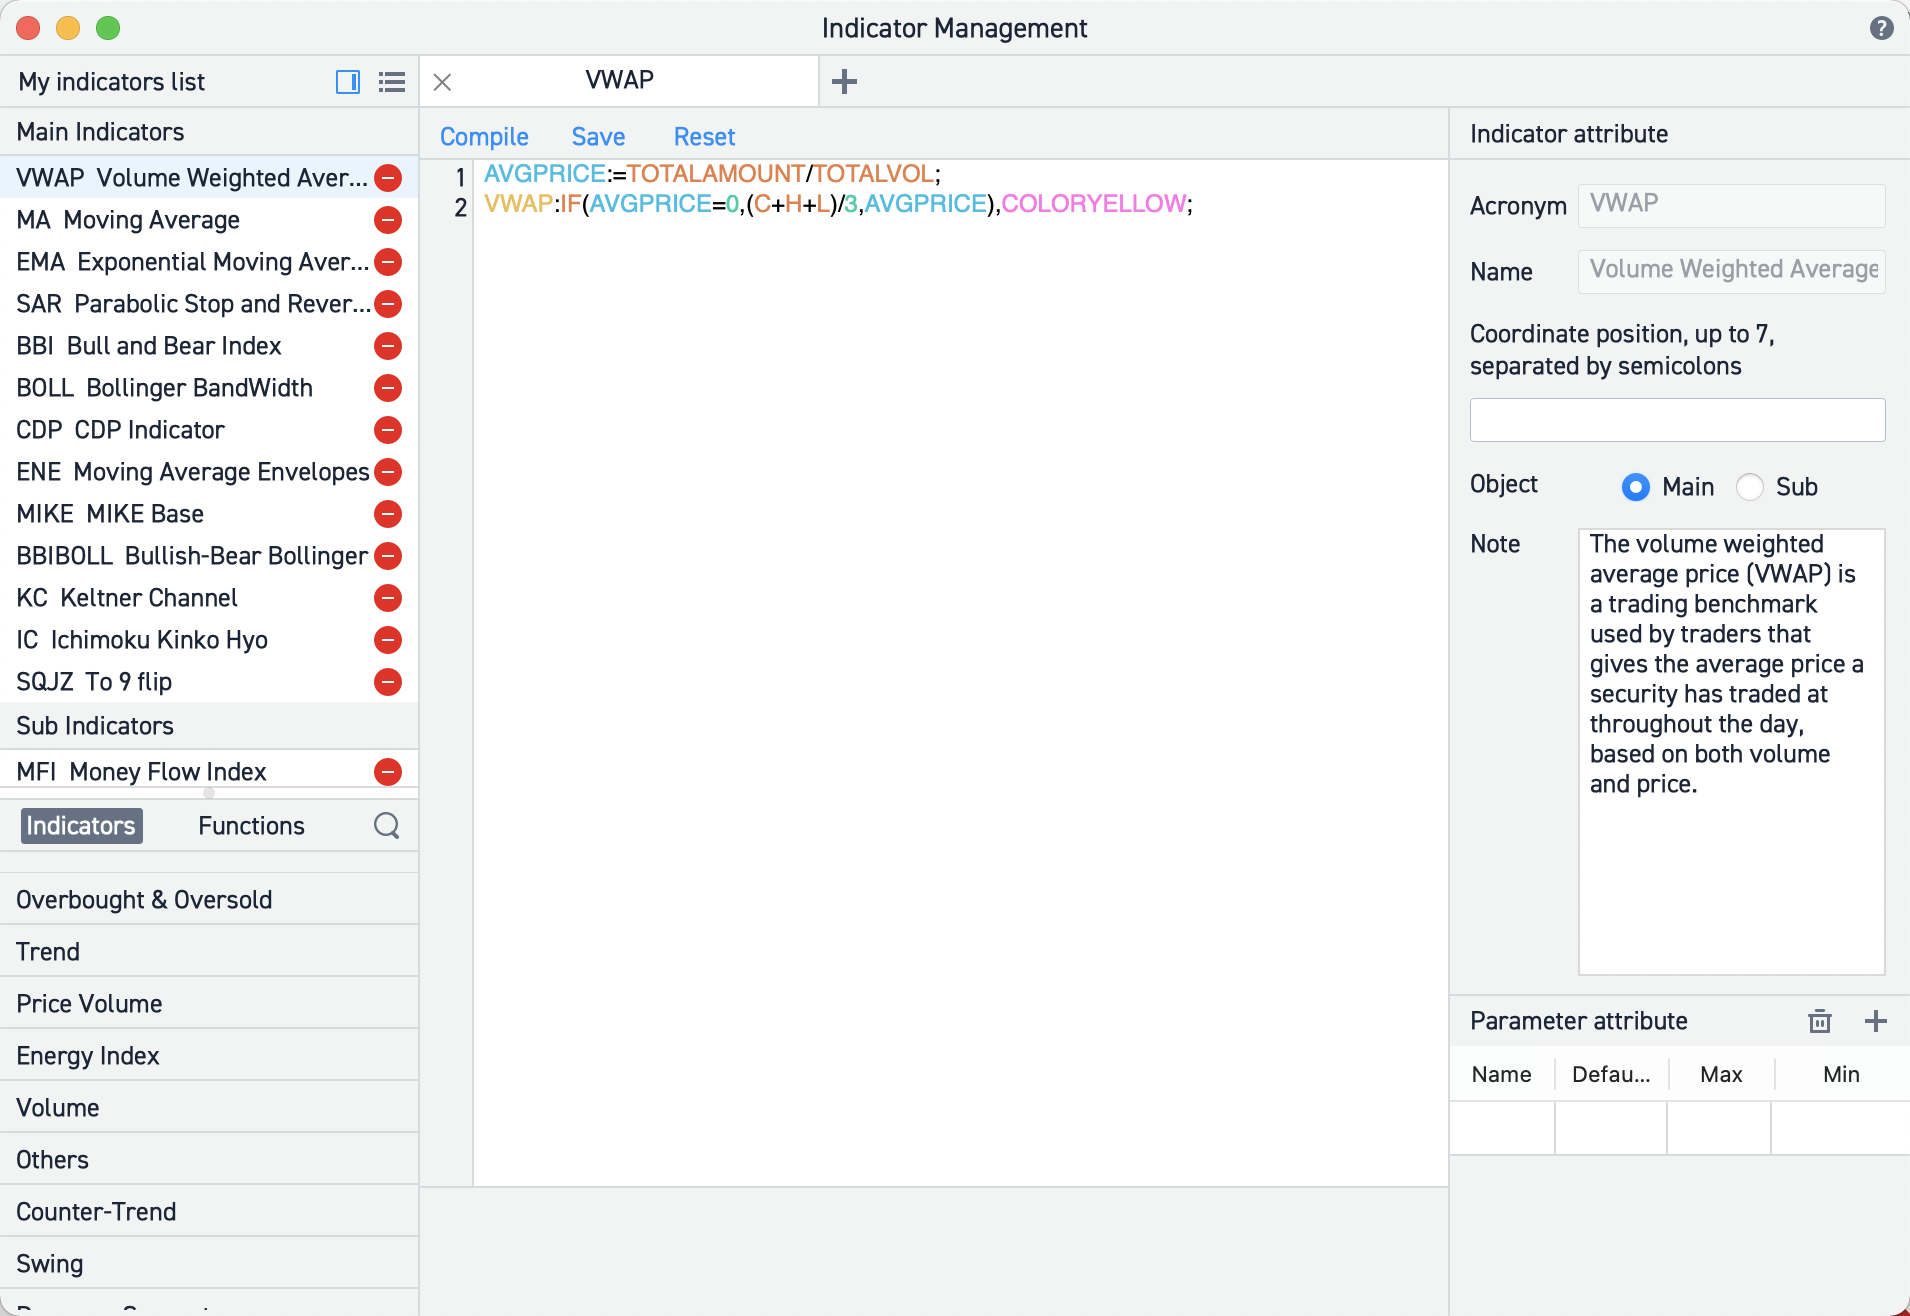
2.3 Quotes chart page - click "Indicator Management" to enter the setting page.