Capital flow introduction
1. Entry
Detailed Quotes -- Capital Tracking (below the Order Book)
2. Brief Introduction
Capital Tracking is a data indicator that analyzes the market's capital flow. By checking the flow of funds, traders can grasp the timing of transactions.
2.1 Trade Overview
From the pie chart, we can understand the proportions of the total turnover of the extra-large orders, large orders, medium orders, and small orders. From the bar chart, we can understand the specific inflow and outflow amounts of extra-large orders, large orders, medium orders, and small orders.

The method for classifying extra-large orders, large orders, medium orders, and small orders:
● Orders in the last 200 days are sorted by transaction amount in descending order:
Extra-large orders: The top 10%
Large orders: 10~30%
Medium orders: 30~55%
Small orders: 55%~100%

2.2 Capital Trend
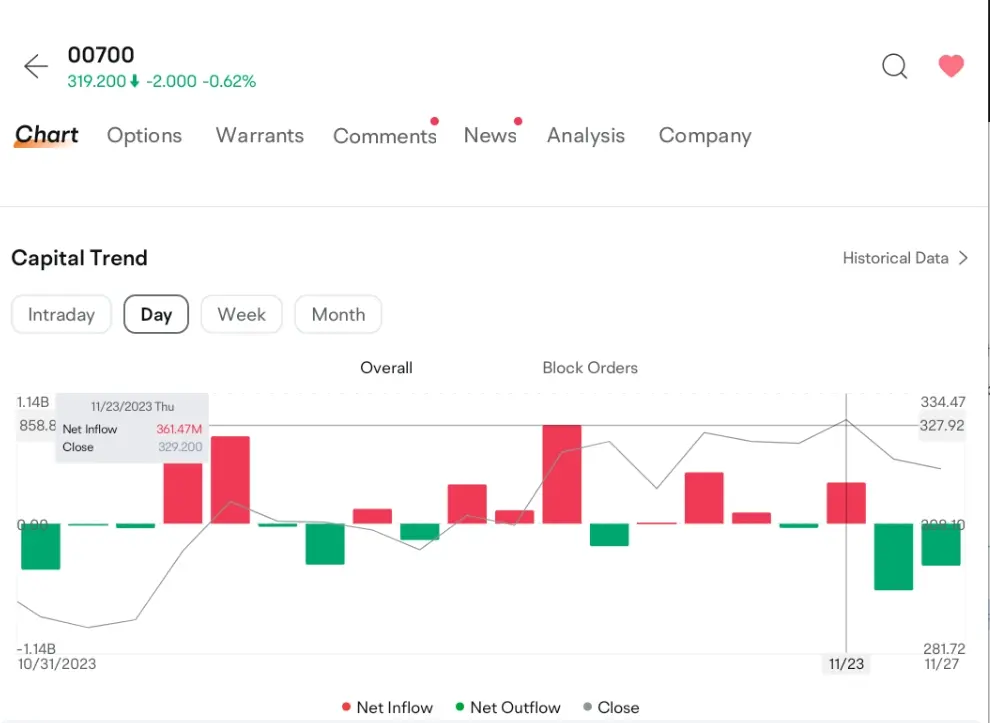
Capital Trend presetns the current fund flow curve of stocks, including 5 curves for overall, extra-large, large, medium, and small orders.
Long press to call up crosshairs and floating windows, which display the net inflow amount of funds for various types of orders at the corresponding time.
The corresponding curve is hidden when the legend is clicked to gray, and one type of order can be viewed separately.

2.3 Historical Capital Flow
Historical capital flow presents multi-period historical capital flow data. Long press to call out the crosshairs and floating window, the floating window displays the value of the net flow of funds and the closing price for time.

2.4 Capital Flow Details
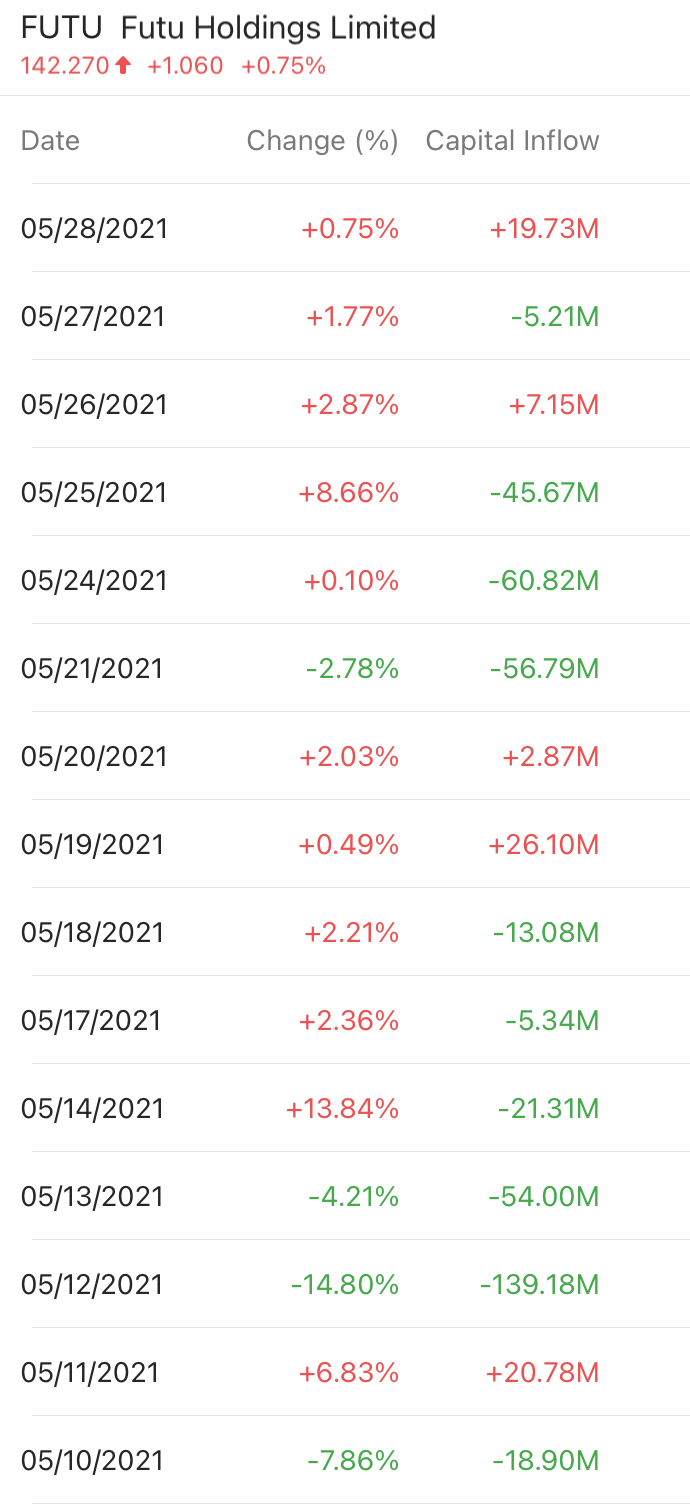
Tap "Historical Data" to view the daily flow details, and you can swipe horizontally to view more data.

3. FAQs
3.1 How to divide the order size of capital?
The history ticker is sorted by transaction amount one by one, and the thresholds for super large, large, medium, and small orders are divided proportionally.
3.2 How to divide the inflow and outflow capital?
If the stock is traded at the selling price or higher, it will be counted as an inflow of funds;
If the stock is traded at the purchase price or lower, it is counted as outflow;
The neutral market is not included in the capital flow.
3.3 How to calculate the net inflow and the block order net inflow?
Net Inflow = Inflow-Outflow
Block Order Net Inflow = Net Inflow Extra Large Orders + Net Inflow Large Orders
3.4 Why does the stock price of a certain stock rise, but its funds have a net outflow on that day?
Because the inflow and outflow of funds has nothing to do with the rise or fall of stock price.
For example:

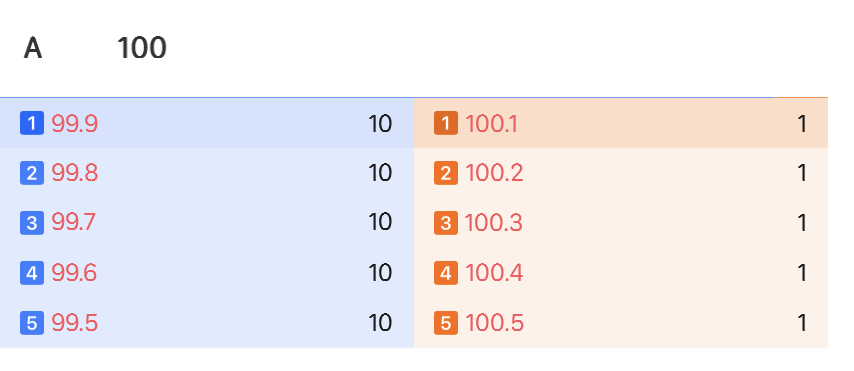
Example 1: The current stock price of a stock A is 100 $, and 10 shares are traded at 99.9 $.
99.9 $ is the purchase price, which is counted as the outflow capital. At this time, the net outflow capital is 999 $, the net outflow of funds and the stock price have fallen.
Example 2: It is also a stock A, the current stock price is 100 $, 10 shares are traded at 99.9 $, and 1 share is traded at 100.1 $.
99.9 $ is the buying price, which is counted as outflow; 100.1 $ is the selling price, which is counted as inflow capital; at this time, the net outflow capital is 898.9 $. At this time, there is a net outflow of funds and the stock price has risen.
This shows that the inflow and outflow of capital has nothing to do with the rise and fall of stock price.