Technical analysis of Hong Kong stocks

Views 45102025.01.16

[Technical rebound] How many current key points can Hong Kong stocks keep in mind

$Hang Seng Index(800000.HK)$ Since yesterday's low of 18,671 points, it has rebounded. As of the moment of writing, today's Hang Seng Index had risen by more than 400 points to a high of 19,314 points. The market once again hopes that the mainland will introduce policies to support the economy before the Spring Festival holiday. The idea of maintaining good liquidity before the holidays is the main hope to support a recovery in market conditions. In fact, there are variables in the implementation of the policy, but the current market consensus is that Hong Kong stocks are a “policy market.”

What I want to say today is that under the “policy market” hype mentality, trends often turn around and make judgments based on technical analysis. This is because they generally look at the bottom and then hope that the policy will be introduced. It is only when news of the policy comes to light that it can be confirmed that the market conditions have improved. For example, after the Hang Seng Index fell by 14,794 points on January 22, 2024, the 14-day RSI was severely oversold and initially fell below the 25.5 level. Then, only after “state-owned enterprise reform” and other related measures were introduced, the market conditions could actually be confirmed to rebound. Simply put, market conditions often start with a technical rebound, then evolve into the beginning of an improvement in the market.

The main reasons supporting the technical rebound in Hong Kong stocks

Distribution map of Ushikuma Stock Exchange

Distribution map of Ushikuma Stock Exchange

On the Futubull app, you can clearly see the distribution of Cow and Bear Stock Exchange, Hang Seng Index -> Revolving Securities -> Cow and Bear Street Stock Distribution. Yesterday, the Hang Seng Index plummeted to 18,671 points. It has basically brought the bullish position to the point where the entire army is being overrun. This also led to funds being viewed as a small incentive to further decline in the short term.

Distribution map of Ushikuma Stock Exchange

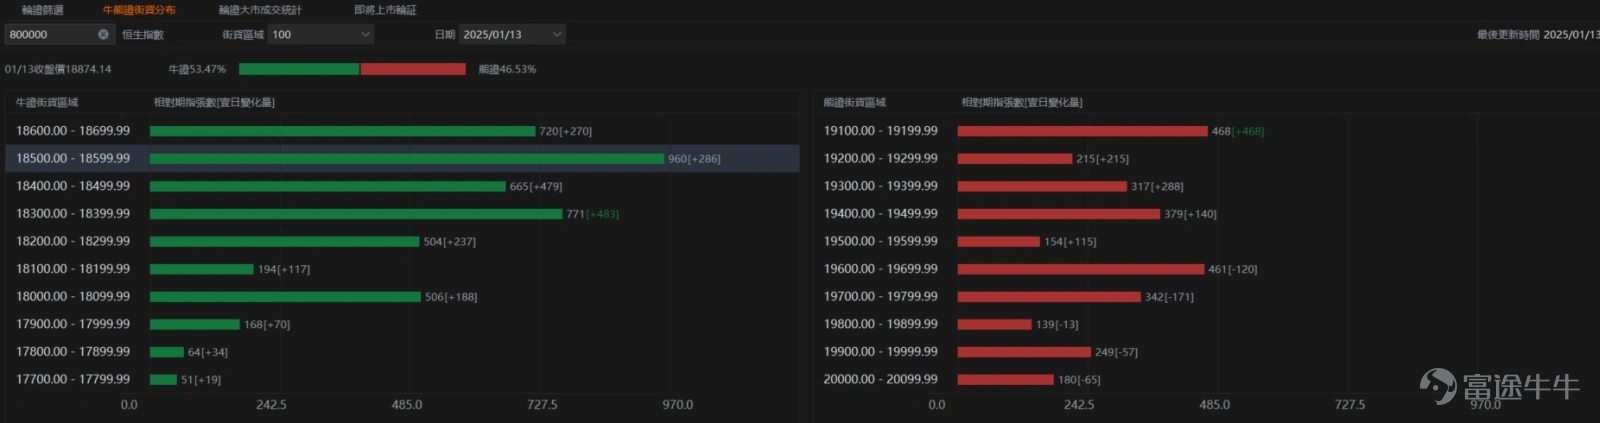
Judging from the latest bulls and bears distribution, although the share of bullish securities is still high, the ratio of bulls and bears is 53.47%: 46.53%, which can be said to be a close level in recent months, plus bullish certificates that have not been priced in the short term. On the other hand, although there is no clear heavy warehouse area, there are quite a few stocks distributed between 19100 and 19699. This is also the reason for the emergence of weak warehouses today.

Reminder: The above analysis of the distribution of Bull and Bear securities should be very thorough. If investors should pay attention to changes in relevant positions, remember that they will also update the latest positions from the previous trading day every morning, and do not abuse them.

Hang Seng Index Technical Analysis

Hang Seng Index Technical Analysis

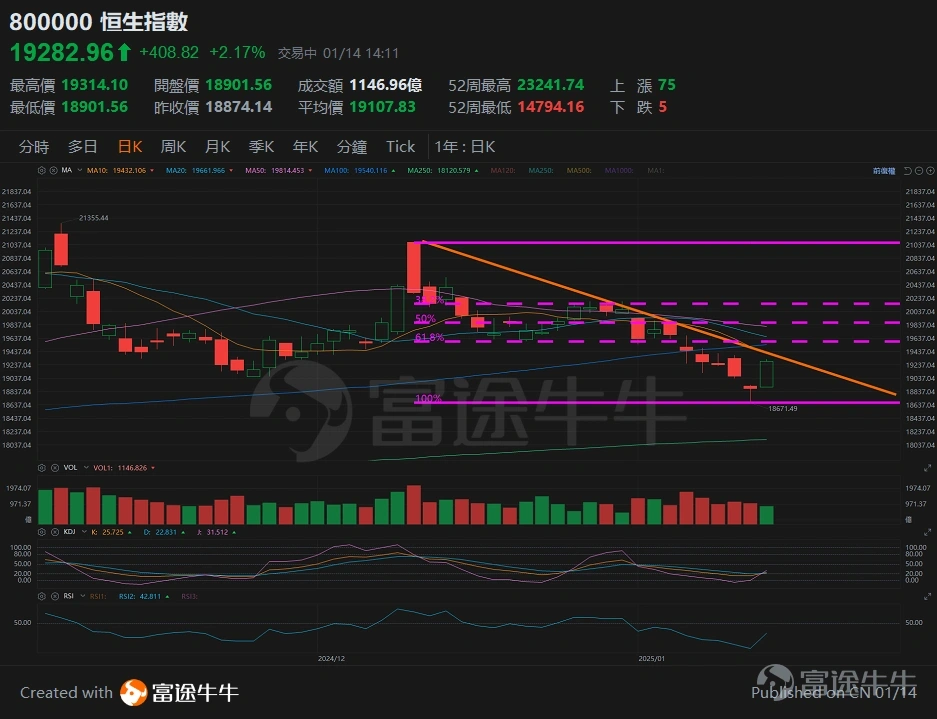
From the perspective of technical analysis, the 14-day RSI of the Hang Seng Index fell to 32, the lowest position in almost a year. Coupled with the K-line of the Hang Seng Index appearing in a “hammer head” pattern yesterday, KDJ is also steadily issuing buy signals today. The possibility of supporting a recovery in market conditions in the short term is increasing, and the value rate leading to a rebound in capital markets has become attractive.

Although today's market conditions have not broken through the upward trend, in the short term, you can first look at the 10-day line or a short-term downward trajectory, at about 19,400 points. If you can break through, you can expect to repair the decline that unfolded from the high level of 21070 points on December 10, 2024 until yesterday, January 13, when the rebound was about 0.382, that is, test the 1,600 point level first.

Hang Seng Index Technical Analysis

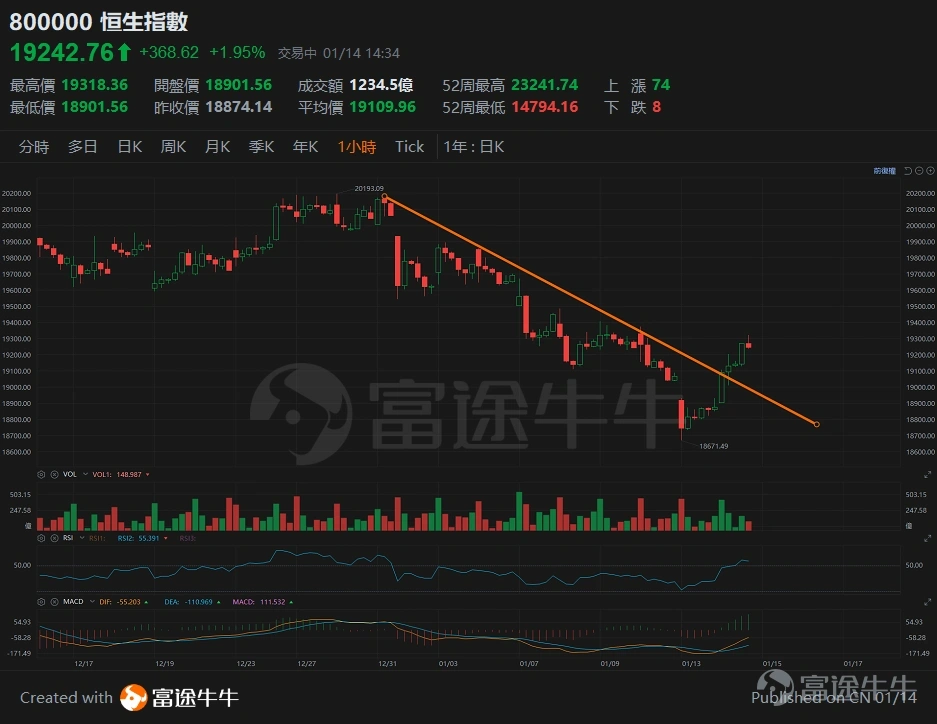
If you look at it again using the above short time chart, it is also in line with the above view of the short-term rebound.

Technical analysis and judgment in the short term

  • First support level: 19090 points (the top of the first Dayang Candle in a small hour chart)

  • Important support level: 18,744 points (bottom of the big shadow candle through the bottom)

  • First resistance level: 19400 points (10-day line)

  • Next resistance level: 19600 points

In terms of index deployment, the most important thing for investors now is to measure individual risk tolerance. It would be good to use betting codes to control the blog's rebound.

There is no change in the opinion of trading stocks or not trading on the market:

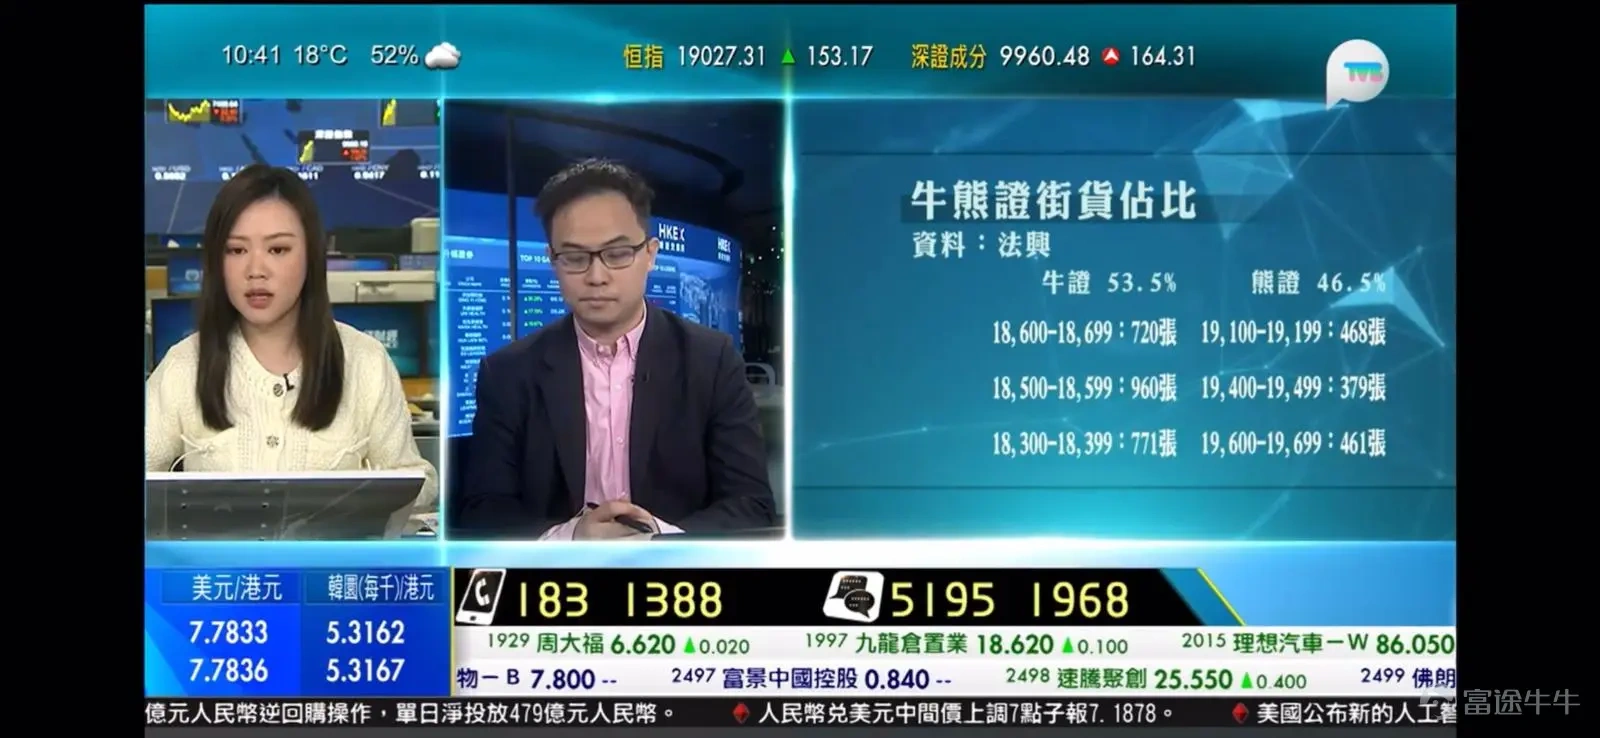
Although there are signs of a recovery in market conditions, I believe that the “stock trading is not market trading” opinion on Hong Kong stocks has not changed much. I also expressed the same opinion at TVB Finance Desk this morning.

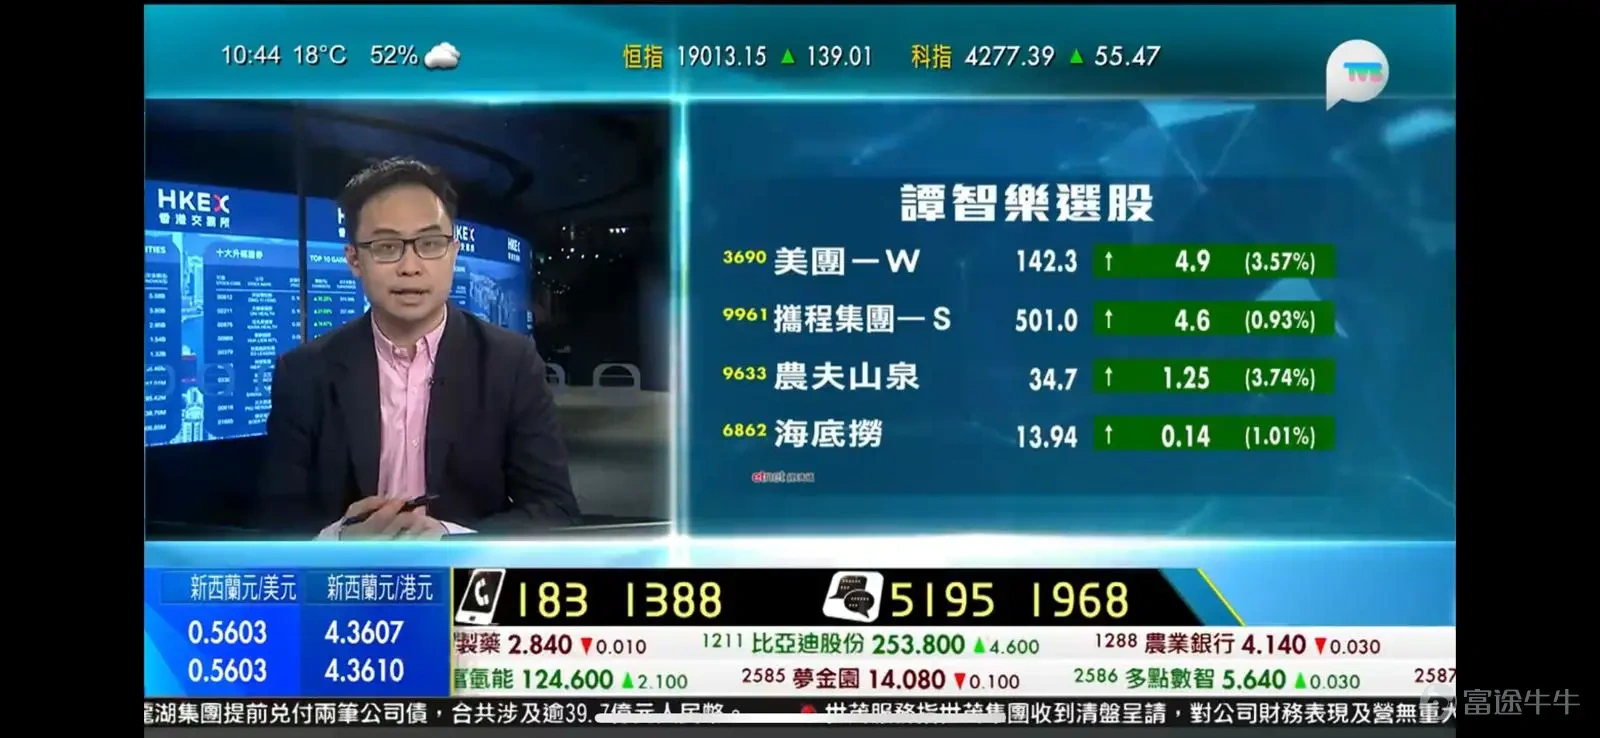
The technical rebound can be watched out for four stocks

The reasons for selecting the above four stocks were taken into consideration for the following reasons

  • There will definitely be policy support on the consumption side

  • There has been no negative news about our individual stocks in the past two months

  • Strong or stable cash flow, winning the market in 2024

  • KDJ issued purchase signals earlier than major markets

Next, let's do a brief analysis of each ship

Meituan

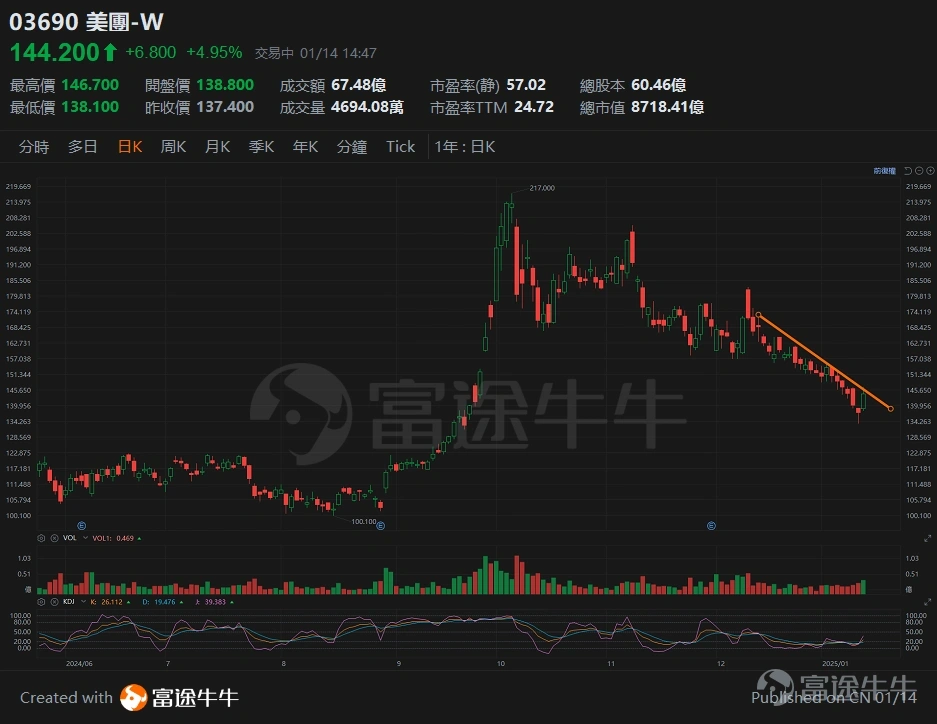
$MEITUAN-W(03690.HK)$ I have always been optimistic about stocks, but in the past two months, market conditions have been quiet, and the real estate and consumer markets have become the hardest hit areas for the stock market. Weak stock prices are inevitable. However, as market conditions are expected to improve, stock prices are also expected to break through a short-term downward trajectory. After all, the company's fundamentals are strong, and losses in the Group's new business in the past have also continued to narrow. Strong fundamentals themselves are the primary factors to consider in the blog's backlash.

Technical analysis
  • Support level: 138 yuan

  • Resistance level: 147 yuan

  • Key resistance level: 158 yuan
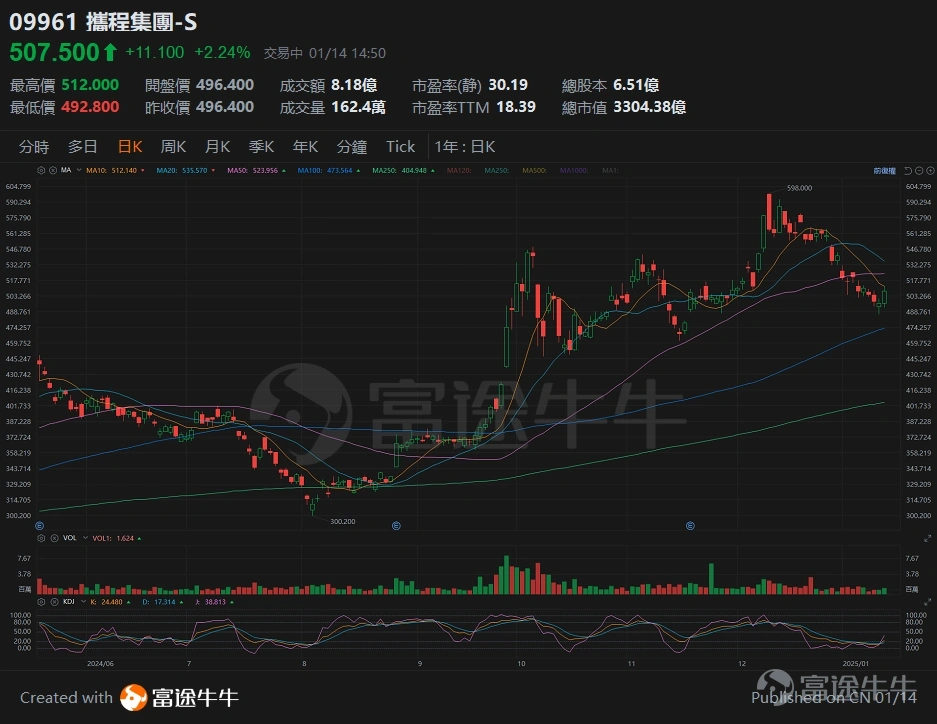
Hecheng Group

$TRIP.COM-S(09961.HK)$ Last year, it was the second largest increase among the Hang Seng Index constituent stocks. A year-on-year increase of 95%. The TTM price-earnings ratio is also only 18.4 times. Profitable outbound travel has little impact on the consumer market. Coupled with the company's stable profitability, I believe this advantage will not change much in the short term.

Technical analysis~
  • Support level: 496 yuan

  • Resistance level: 512 yuan

  • Key resistance level: 542 yuan

Nongfu Spring

$NONGFU SPRING(09633.HK)$ As a leader in mass necessities, there are quite a few major banks that have maintained a positive view on necessities stocks this year, believing that leading brands have benefited from the downgrade in consumption, and the impact last year was not anticipated. The company's price-earnings ratio is still below 30 times. Driven by the brand's advantage, I think I can start watching.

Technical analysis~
  • Support level: 33.5 yuan

  • Resistance level: 35.5 yuan

  • Key resistance level: 39.2 yuan
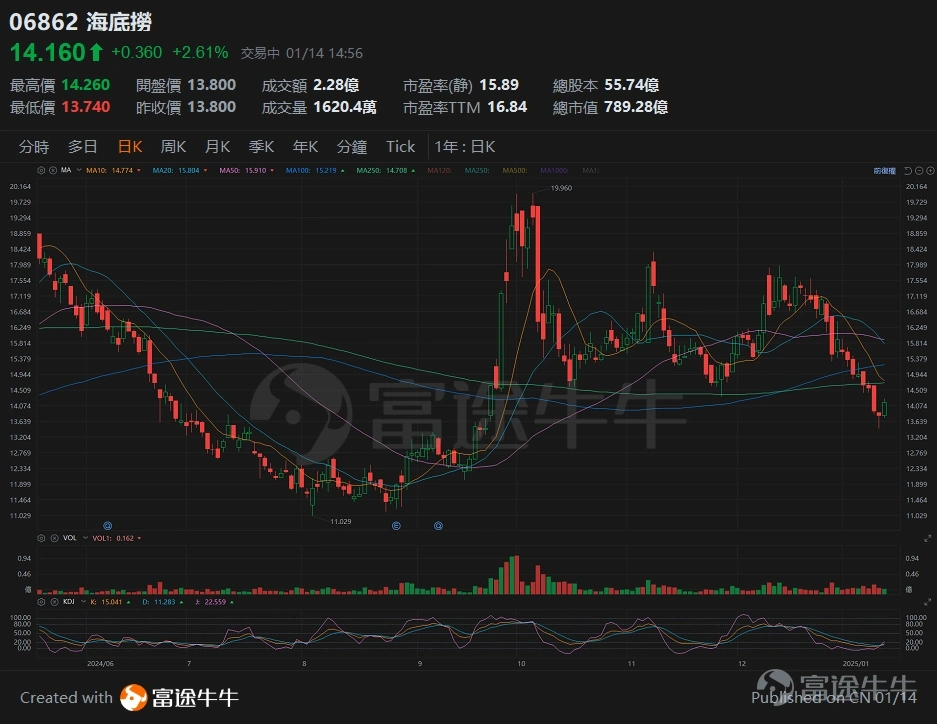
Undersea turtles

$HAIDILAO(06862.HK)$ It is a non-essential consumer stock. The author has also been optimistic about stocks in the fourth quarter of last year. The company's same-store sales and turnover rate have also begun to slowly improve, and cash flow and profit models have also begun to stabilize, and valuations below 20 times PE are still attractive.

Technical analysis~
  • Support level: 13.8 yuan

  • Resistance level: 14.6 yuan

  • Key resistance level: 16.0 yuan

Xiaomi Group

Of course, the stocks that can be purchased will not be just the above four, but today I have selected them under the circumstances where TVB has limited time. Stocks with strong fundamentals can still be considered, such as the biggest increase last year $XIAOMI-W(01810.HK)$ . Recently, it has been affected by news of the Ministry of Defense's black list of relations between China and the US, but in reality, there have been no real negative factors for the time being, and it is expected to recover in the near future with market conditions.

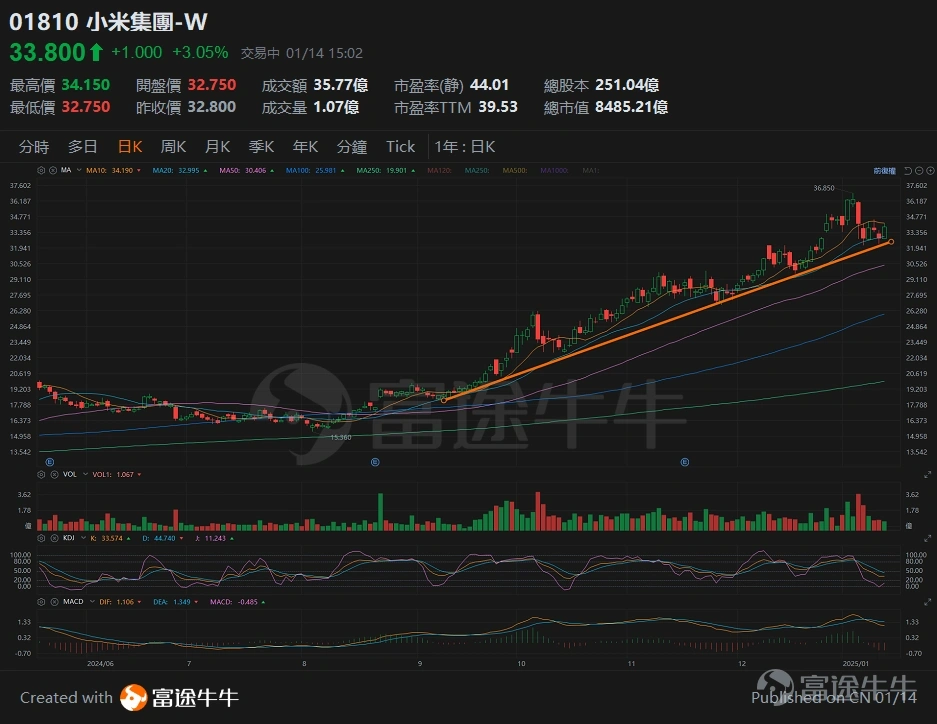
Although KDJ did not issue a purchase signal, it has not lost its mid-term upward trajectory, and even the moving average still maintains a favorable “multi-head arrangement” pattern. This type of stock is relatively suitable for medium- to long-term deployments.

Technical analysis~
  • Support level: 32.5 yuan

  • Resistance level: 34.5 yuan

  • Key resistance level: 36.85 yuan

  • Author Information

    Tan Zhi Le, Chief Analyst of Futu Securities

    (The author is a licensee of the Securities and Exchange Commission and its affiliates do not have any financial interest in the Proposed Share Issuer)

One-stop trading with Futubull

Enjoy welcome rewards and lifetime 0 commission on HK stocks

Terms and conditions apply right-arrow

| GENERAL DISCLAIMER |

This report (the “Report”) is prepared by Futu Securities International (Hong Kong) Limited (“Futu Securities”). The person who retained this Report either via receiving and/or reading  (including any relevant attachment), shall agree to be bound by the terms and limitations set out below as has the right to retained this Report. Any failure to comply with these limitations may constitute a violation of the law.

This Report shall not be reproduced in whole or in part, distributed or published by you for any purpose. Futu Securities shall not be liable for any direct or consequential loss arising from any use of material contained in this Report.

The information contained in this Report has been obtained from public sources which Futu Securities has no reason to believe are unreliable and any analysis, forecasts, projections, expectations and opinions (collectively the “Research”) contained in this Report are based on such information and are expressions of belief only.

Futu Securities has not verified this information and no representation or warranty, express or implied, is made that such information or Research is accurate, complete or verified or should be relied upon as such. Any such information or Research contained in this Report is subject to change, and Futu Securities and/or its affiliated companies (collectively the “Futu Group”) shall not have any responsibility to maintain the information or Research made available or to supply any corrections, updates or releases in connection therewith. In no event will Futu Securities be liable for any special, indirect, incidental or consequential damages which may be incurred from the use of the information or Research made available, even if it has been advised of the possibility of such damages.

Any opinions, forecasts, assumptions, estimates, valuations and prices contained in this Report are as of the date indicated and are subject to change at any time without prior notice.

This Report is intended for general circulation only and does not take into account the specific investment objectives, financial situation or particular needs of any particular person. This Report should not and does not constitute an offer, solicitation, invitation, recommendation for buying or selling of investment products or as basis on making any investment decision, or constitute as professional advice from any member of Futu Group. The products mentioned in this Report may not be suitable for all investors and a person receiving or reading this Report should seek advice from a financial adviser regarding the suitability of such products, taking into account the specific investment objectives, financial situation or particular needs of that person, before making a commitment to invest in any of such products.

This Report should not be relied upon as authoritative without further being subject to the recipient’s own independent verification and exercise of judgment. The fact that this Report has been made available constitutes neither a recommendation to enter into a particular transaction nor a representation that any product described in this Report is suitable or appropriate for the recipient. Recipients should be aware that many of the products which may be described in this Report involve significant risks and may not be suitable for all investors, and that any decision to enter into transactions involving such products should not be made unless all such risks are understood and an independent determination has been made that such transactions would be appropriate. Any discussion of the risks contained herein with respect to any product should not be considered to be a disclosure of all risks or a complete discussion of such risks.

This report is provided by Futu Securities, which is regulated by the Securities and Futures Commission of Hong Kong (SFC) in Hong Kong. If you have any questions about the Futu Securities Research Report, please contact Futu Securities. The CE number of SFC held by the author has been disclosed next to the author's name on the front page of the Report.

Nothing in this Report shall be construed to be an offer or solicitation for the purchase or sale of a security. Any decision to purchase securities mentioned in this research should take into account existing public information, including any registered prospectus in respect of such security.

The Relevant Report does not have regard to any individual-specific investment objectives or financial situation. Individual investors should seek professional advice from an independent financial adviser, and refer to the relevant offering documents and/or other latest published information on the ETF including the risk factors regarding the suitability of specific investment products.

Information in the Relevant Report has been obtained or derived from sources generally available to the public and believed by the analyst(s) to be reliable.

All investments carry risks, and it is possible to lose the entire investment amount. Any past performances, projections, forecasts or simulation of results are not necessarily indicative of the future performance of any investments.

The ETF has not been and will not be authorised by the SFC under section 104 of the SFO. The Relevant Report does not constitute an advertisement, invitation or document which is or contains an invitation to the Hong Kong public to acquire an interest in or participate in a collective investment scheme under section 103 of the SFO.

| Certification |

Analyst(s) certified that (i) the views expressed in this Report accurately reflect his/her personal views on the listed corporation in this Report; and (ii) no part of his/her compensation was, is or will be, directly or indirectly, related to the specific recommendations or views expressed in this Report.

Analyst(s) certified that he/she and/or his/her associate did not deal in or trade the listed corporation or its relevant securities within the 30 days prior to and 3 business days after the issue of this Report.

| Disclosure of Interest |

Analyst Disclosure: Neither the analyst(s) preparing this Report nor his/her associate has any financial interest in or serves as an officer of the listed corporation covered in this Report.

Firm’s Disclosure: Futu Securities does not have any investment banking relationship with the listed corporation covered in this Report in the past 12 months nor any financial interest of 1% or more of the market capitalization in the listed corporation. In addition, no executive staff of Futu Securities serves as an officer of the listed corporation.

| Availability |

The information, tools and material presented herein are not directed, intended for distribution to or use by, any person or entity in any jurisdiction or country where such distribution, publication, availability or use would be contrary to the applicable law or regulation or which would subject Futu Securities to any registration or licensing or other requirement, or penalty for contravention of such requirements within such jurisdiction.

Information contained herein is based on sources that Futu Securities believed to be accurate. Futu Group and/or relevant personnel (i.e., employees of Futu Group) may have positions and transactions in relevant investment products. Futu Group and/or relevant personnel does not bear responsibility for any loss suffered by the investor from the use of or reliance on the information set out in this report.

For details of different product's risks, please visit the Risk Disclosures Statement on http://www.futuhk.com.

This Report is written in Chinese and English, and the two versions are equally valid. If there is any contradiction between the two versions, the English version shall prevail.


Recommended

    Market Insights
    HK Tech and Internet Stocks
    View More
    Nancy Pelosi Portfolio
    Will the 'tariff stick' strike again? Will the market remain 'reactive'?
    China and the United States have successively adjusted multiple tariff and non-tariff measures, beginning to implement the consensus outcome Show More